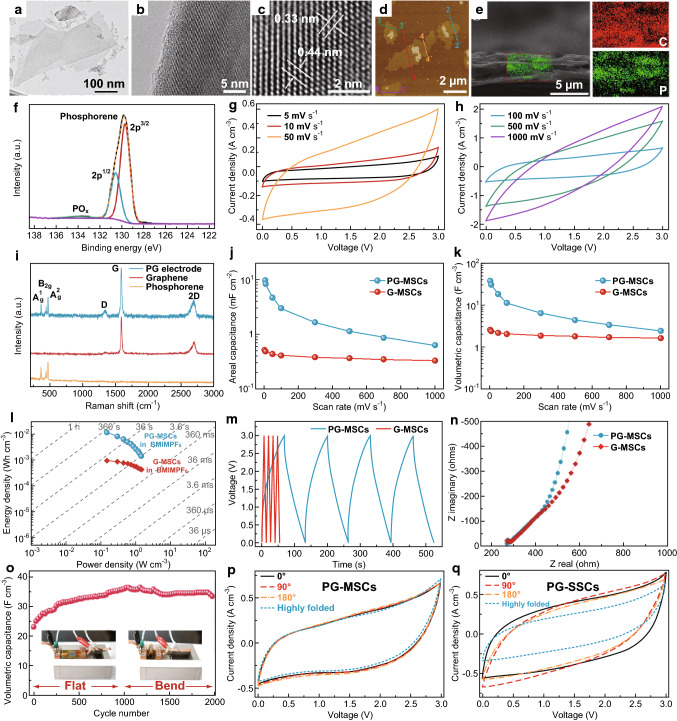
Fig. 10.
Structural characterization and electrochemical performance analysis of phosphorene as a supercapacitor electrode: a TEM image of phosphorene thin film b HRTEM image of the phosphorene thin film. c HRTEM micrograph of the phosphorene thin film with atomic positions and lattice parameters. d AFM image of the phosphorene thin film. e SEM image of the cross section of the phosphorene thin film with EDX spectra of the selected region. f XPS spectra of phosphorene thin film. g, h CV at varying scan rates of P/G anode and G anode, respectively. i XRD spectra stack of the phosphorene (orange), graphene (red) ,and P/G composite electrode (blue). j Aerial capacitances of P/G (blue) and G (red) samples. k Volumetric capacitances of P/G (blue) and G (red) samples. l Ragone plots of P/G (blue) and G (red) samples. m GCD curves of the P/G (blue) and G (red) samples at a current density of 0.3 A cm−3. n Complex part of the impedance spectra of P/G (blue) and the G (red) samples. o Stability performance of the P/G sample over 2000 cycles with the inset pictures showing the flat and bending orientations. p CV curves of the P/G composite micro-supercapacitor. q CV curves of the P/G composite on PET substrate [174]. Copyright 2017 American Chemical Society. (Color figure online)

