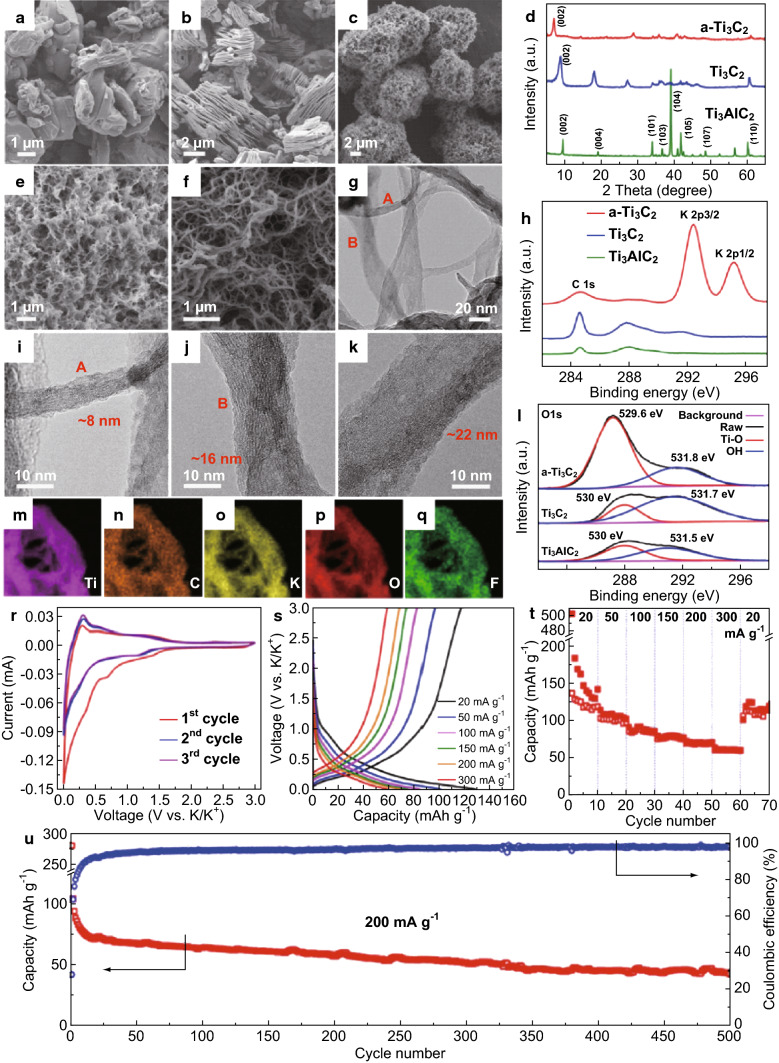
Fig. 7.
Structural characterization and electrochemical performance analysis of MXene as electrode material in KIB: a–c SEM images of Ti3AlC2 MAX phase, Ti3C2 MXene nanosheets (MNSs) obtained by etching the precursor MAX phase with 40% HF solution and KOH-treated Ti3C2 MNSs (a-Ti3C2), respectively. d XRD spectra stack of Ti3AlC2, Ti3C2 and a-Ti3C2. e SEM image of Ti3C2 MXene nanoribbons (MNRs) at low magnification. f Corresponding image at high-magnification g TEM image of MNRs h XPS spectra of Ti3AlC2, Ti3C2, and a-Ti3C2 showing the free C and K peaks. i–k HRTEM images of the Ti3C2 MNRs at different positions (“A” and “B”) and varying thicknesses (8, 16, and 22 nm). l XPS spectra of the 3 samples showing the O 1s peak. m–q Elemental mapping of Ti, C, K, O and F regions of the a-Ti3C2 sample, respectively. r CV of the a-Ti3C2 MNRs for KIB collected at a scan rate of 0.1 mV s−1. s GCD curves of the sample obtained at different given current rates. t Rate capability of the a-Ti3C2 sample. u Cycling performance at 200 mA g−1 and coulombic efficiency for the a-Ti3C2 sample [145]. Copyright 2018 Elsevier

