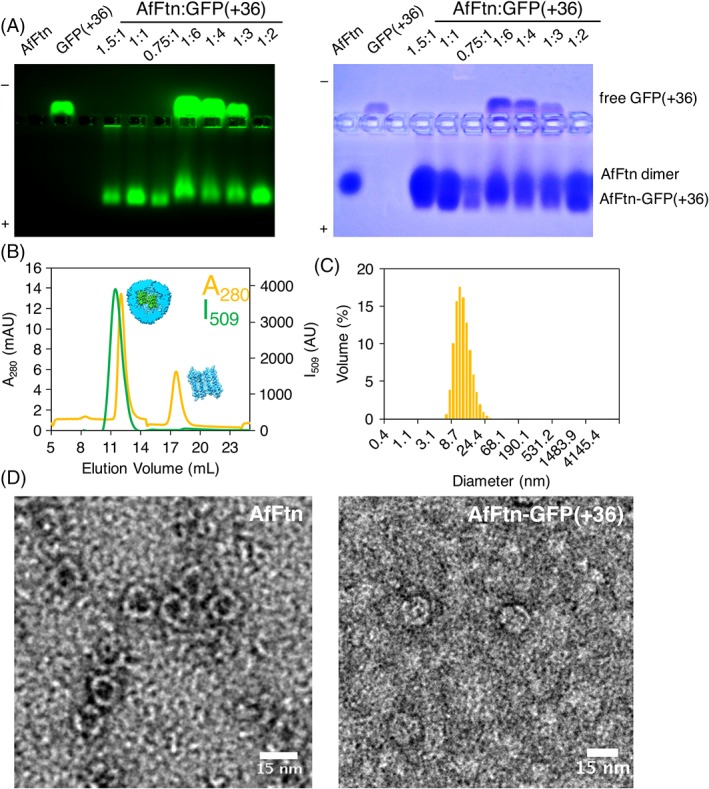
Figure 2.

(A) Native gel electrophoresis varying AfFtn 24mer:GFP(+36) stoichiometry. The green band traveling toward the positive terminal can be attributed to the AfFtn–GFP(+36) encapsulation product, while the green band traveling toward the negative terminal corresponds to free or excess GFP(+36). “1” = concentration of 0.6 μM. (B) SEC of AfFtn–GFP(+36) complex, monitored by absorbance at 280 nm (A 280, yellow) and fluorescence at 509 nm (I509, green). Peak at 12.5 mL corresponds to AfFtn–GFP(+36), peak at 17.5 mL corresponds to AfFtn dimer (6 μM AfFtn, 12 μM GFP(+36)). (C) Dynamic light scattering diameter size distribution of sample corresponding to SEC peak at 12.5 mL. Average diameter is 13.9 nm with PDI of 0.26, matching that of assembled AfFtn without GFP(+36) present (6 μM AfFtn, 12 μM GFP(+36)). (D) TEM micrographs of AfFtn without (left) and with (right) GFP(+36), stained with uranyl acetate. Scale bars are 15 nm.
