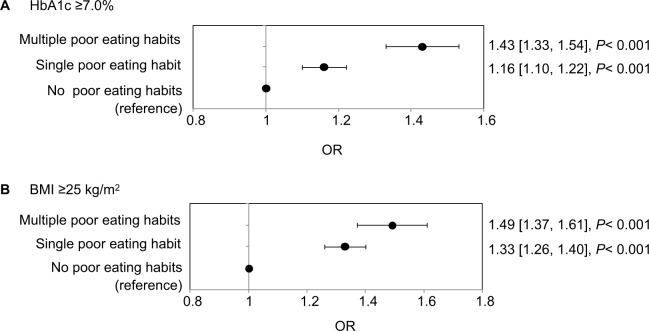
Figure 3.
ORs (95% CIs) for (A) HbA1c ≥7.0% and (B) BMI ≥25 kg/m2 by poor eating habit.
Notes: The ORs, 95% CIs, and P-values were evaluated by multivariate logistic regression using sex, age, exercise habit, sleep, alcohol consumption, and diabetes treatment history as covariates. The reference subgroup was those workers who answered “No” to all three poor eating habit questions.
Abbreviations: BMI, body mass index; HbA1c, glycated hemoglobin.

