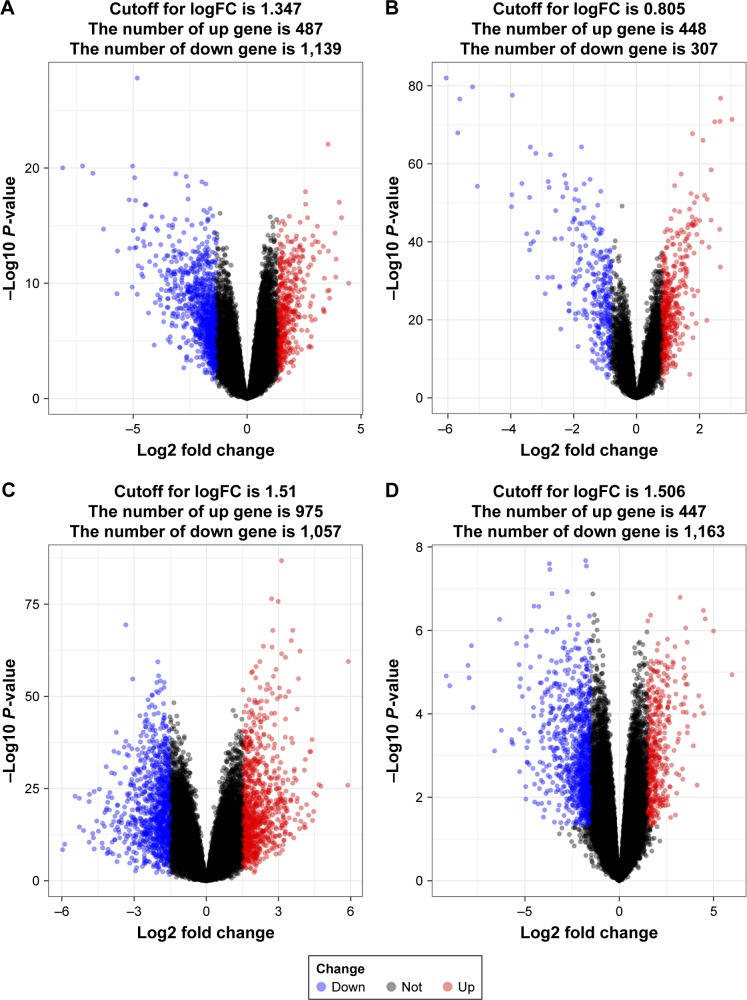
Figure 1.
Identify differentially expressed genes.
Notes: Visualization of the identified differentially expressed genes (DEGs) were performed by volcano plots. Dots represent genes with color coding: red indicates upregulated, blue indicates downregulated and black indicates not DEGs. (A) A total of 1,626 genes (487 upregulated and 1,139 downregulated genes) in GSE13911 were detected. (B) There were 755 genes (448 upregulated and 307 downregulated genes) in GSE29272. (C) A total of 2,032 genes (975 upregulated and 1,057 downregulated genes) in GSE54129 were filtered as DEGs. (D) A total of 1,610 genes (447 upregulated and 1,163 downregulated genes) in GSE79973 were found.

