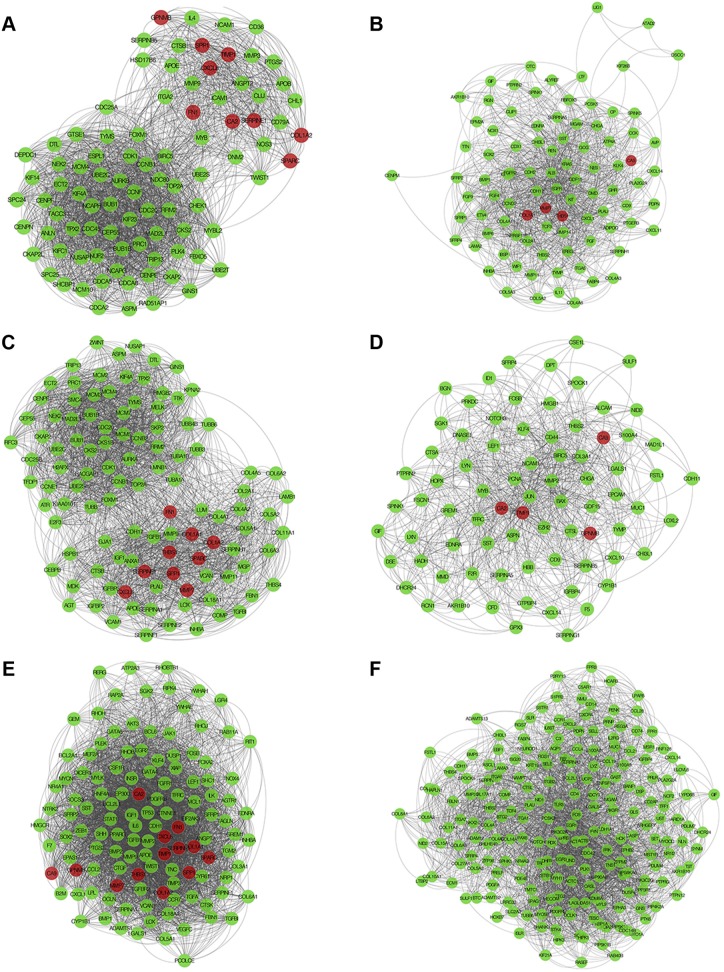
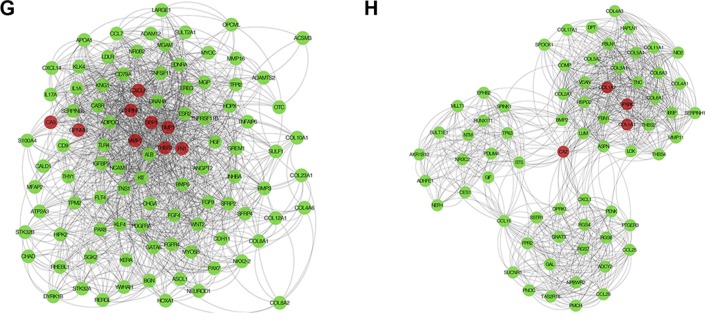
Figure 3.
Clusters of genes in co-expression network in gastric cancer.
Notes: (A) Cluster one and (B) cluster two in GSE13911. (C) Cluster one and (D) cluster two in GSE29272. (E) Cluster one and (F) cluster two in GSE54129. (G) Cluster one and (H) cluster two in GSE79973. Common hub genes were drawn with red circle, others were used green circle.


