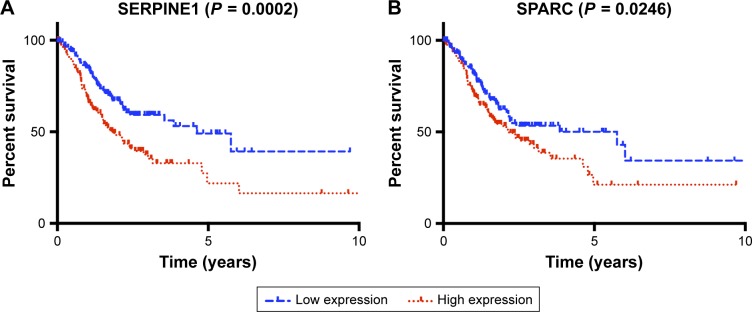
Figure 4.
Overall survival curves based on SERPINE1 and SPARC expression.
Notes: The expression of SERPINE1 and SPARC was divided into low and high groups according to the median and the overall survival was assessed by Kaplan–Meier analysis. (A) SERPINE1 high expression was significantly associated with poor survival (P = 0.0002). (B) SPARC high expression was significantly associated with poor survival (P = 0.0246).

