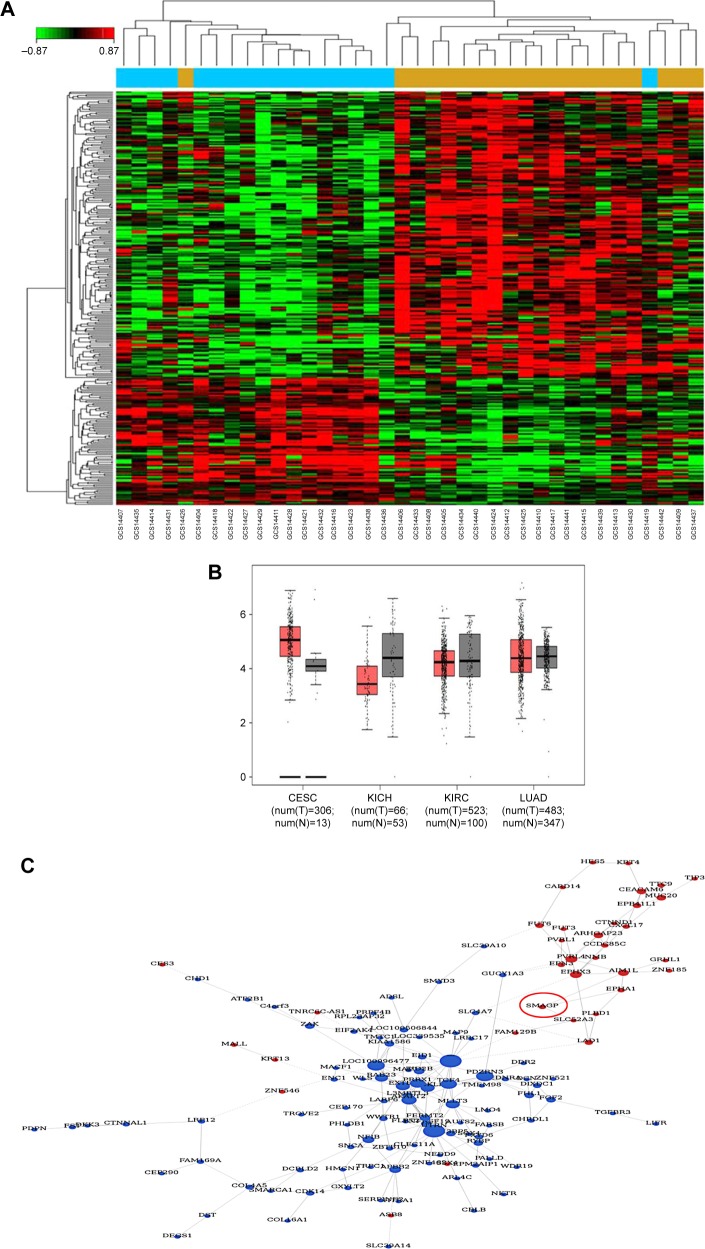
Figure 1.
Expression profiles of SMAGP in cervical cancer determined using informatics-based methods.
Notes: (A) Heat map of genes differently expressed between cervical cancer and normal tissues. (B) Co-expression network diagram of mRNA. Red, overexpression; blue, downregulation. SMAGP was selected for further investigation. (C) Comparison of SMAGP mRNA expression levels among various cancers: cervical squamous cell carcinoma and endocervical adenocarcinoma, chromophobe cell carcinoma of the kidney, kidney renal clear cell carcinoma and adenocarcinoma of the lung.

