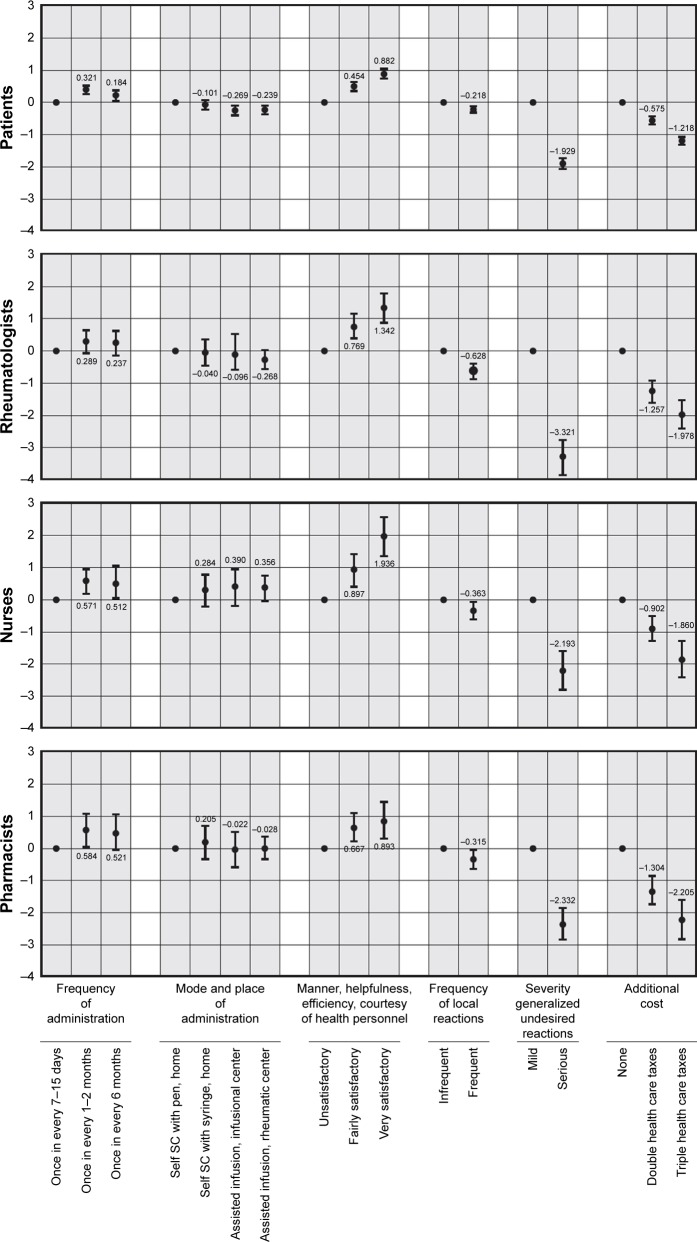
Figure 3.
Preferences for each characteristic level by group.
Notes: The position of each dot indicates the amount of estimated preference of each characteristic level moving from the reference level of that characteristic: the greater the difference, the higher (for positive estimates) or the lower (for negative estimates) the importance of that level is, compared with the reference level within that characteristic. The vertical segments represent the 95% CIs of each preference estimate. If the CIs do not overlap between the different levels of a particular characteristic, the mean estimates are significantly different from each other at the 5% level of significance. Otherwise, when the CIs overlap between each other or with the dot, the preferences for the involved levels are not statistically significant.
Abbreviation: SC, subcutaneous.

