Figure 8.
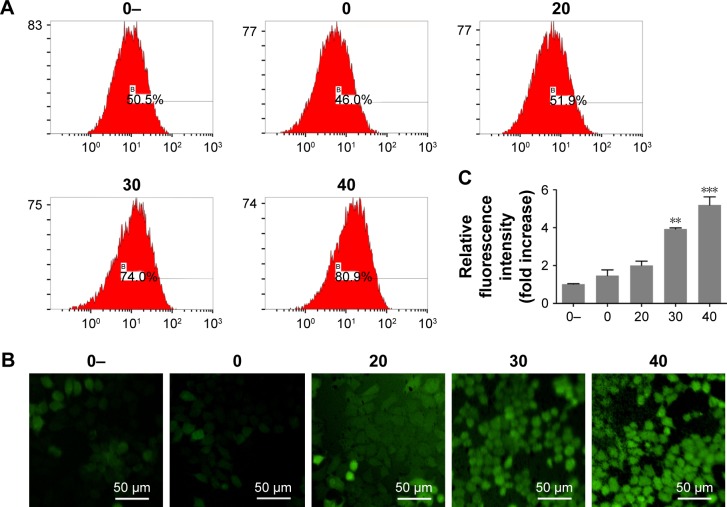
ROS generation in T24 cells incubated with different concentrations of Au–Ag@PDA NPs at 3 hours after photothermal treatment with a power density of 1 W/cm2 for 4 minutes.
Notes: (A) ROS levels evaluated by FCM. (B) ROS levels observed by fluorescent microscopy. (C) Mean fluorescence intensity ratio compared with the 0- control group (mean±SD; n=3). (0-: 0 µg+no laser, 0: 0 µg+laser, 20: 20 µg+laser, 30: 30 µg+laser, 40: 40 µg+laser). **P<0.01, ***P<0.001 vs 0 group.
Abbreviations: FCM, flow cytometry; NPs, nanoparticles; PDA, polydopamine.

