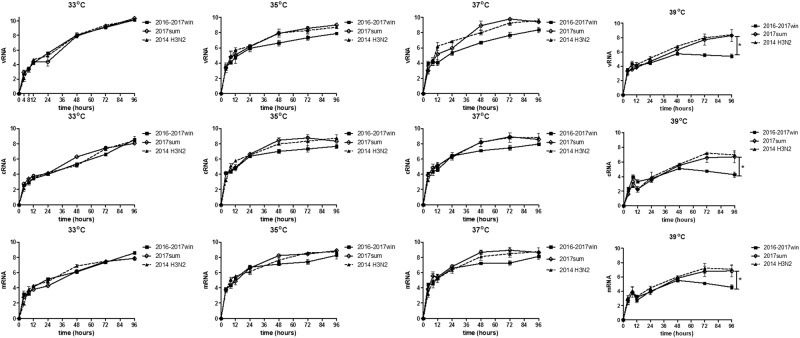
Fig. 4. Quantity of vRNA, cRNA and mRNA in infected MDCK cells at 33, 35, 37, and 39 °C.
MDCK cells were infected with 2016–2017win, 2017sum and 2014 H3N2 viruses at an MOI of 0.02 and incubated at 33, 35, 37, and 39 °C. The viral vRNA, cRNA, and mRNA of the NP segment in each sample were normalized by a standard curve. The error bars indicate the standard error of the mean. The P-values were statistically analyzed by paired t test. P < 0.05

