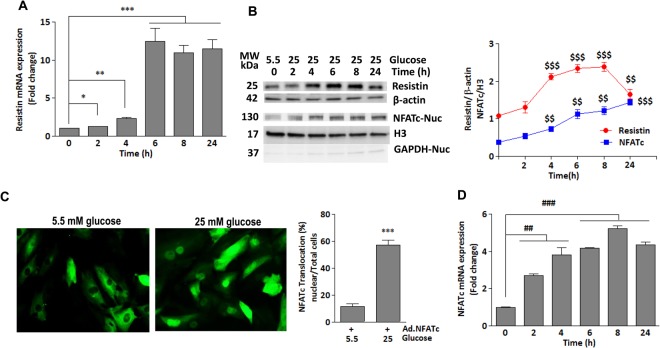
Figure 2.
Glucose upregulates resistin expression through activation of NFATc in vitro- H9c2 cells were treated with high glucose concentration (25 mM vs. 5.5 mM) for the indicated times. The mRNA expression of resistin (A) and NFATc (D) was analyzed by q-PCR. 18S rRNA was used as an internal control (A,D). (C) Representative fluorescence microscopic images of nuclear translocation of NFATc-GFP overexpressed in H9c2 cells for 48 hours and then stimulated with high glucose for an additional 4 hours. Quantification of % nuclear import in cells from 5–6 different images is shown (C) ***p < 0.001 vs low glucose. Western blotting analysis and densitometry quantification of resistin and nuclear NFATc protein expressions (B) are shown. β-actin and H3 were used as internal controls, respectively (B). GAPDH also verified purity of nuclear fraction (B). The data are mean ± SEM of at least three experiments in triplicates. *p < 0.05 0 hr vs 2 hrs; **p < 0.01 0 hr vs 4 hrs ***p < 0.001 0 hr vs 6–24 hrs; $$p < 0.01 and $$$p < 0.001 vs 0 hr; ##p < 0.001 0 hr vs 2–4 hrs, ###p < 0.001 0 hr vs 6–24 hrs.

