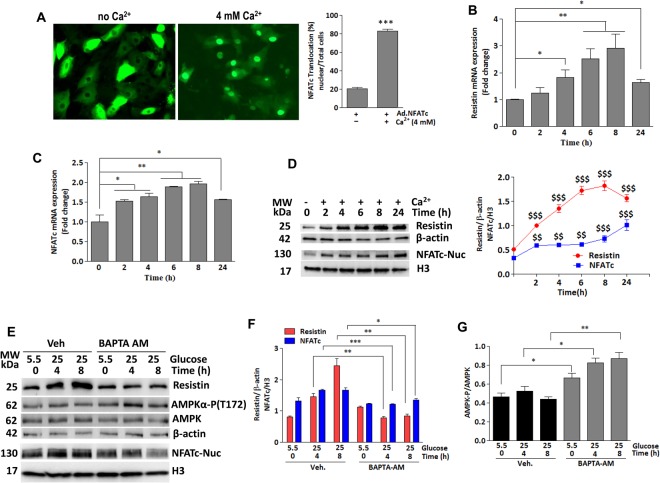
Figure 3.
Calcium drives glucose-induced expression of resistin and NFATc. (A) Representative fluorescence microscopic images of nuclear translocation of NFATc-GFP overexpressed in H9c2 cells for 48 hours and then stimulated with Ca2+ for an additional 4 hours. Quantification of % nuclear import in cells from 5–6 different images is shown (A). ***p < 0.001 vs no Ca2+. H9c2 cells were treated with 4 mM Ca2+ for the indicated times. The mRNA expression of (B) resistin (cytosolic fraction) and (C) NFATc (nuclear fraction) was analyzed by q-PCR. 18S rRNA was used as an internal control. The data are mean ± SEM of three different experiments in triplicates. *p < 0.05 0 hr vs 4 and 24 hrs; **p < 0.01 0 hr vs 6–8 hrs (B); *p < 0.05 0 hr vs 2–4 hrs, and 24 hrs; **p < 0.01 0 hr vs 6–8 hrs (C). Western blotting analysis and densitometry quantification of resistin and nuclear NFATc proteins expression are shown (D). $$p < 0.01 and $$$p < 0.001 vs 0 hr. To verify Ca2+ specificity, H9c2 cells were treated with BAPTA-AM (2 μM) and stimulated with high glucose concentration (25 mM vs. 5.5 mM) for the indicated times. The protein expression of resistin, nuclear NFATc and Phosphorylation of AMPKα were analyzed by western blotting (E) with densitometry quantification shown in (F and G, respectively). Phosphorylation of AMPKα is presented as phospho-AMPK/AMPK ratio. H3 was used as an internal control for NFATc nuclear expression, β-actin was used as an internal control for the other proteins; (E) *p < 0.05, **p < 0.01 and ***p < 0.001 Veh vs BAPTA-AM at the indicated hrs. (G) *p < 0.05 and **p < 0.01 Veh vs BAPTA-AM at the indicated hrs.

