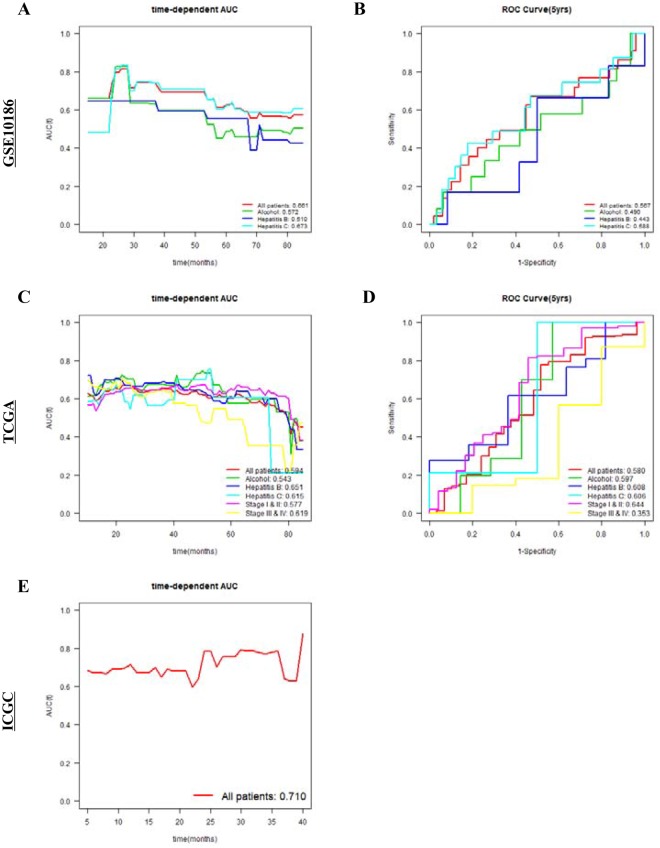
Figure 3.
Time-dependent area under the curve (AUC) analysis and receiver operating characteristic (ROC) curves at 5 years with respect to SAC3D1 gene expression in the GSE10186, TCGA, and ICGC cohorts. Time-dependent AUC analysis and ROC curves at 5 years in the GSE10186 (A,B), TCGA (C,D), and ICGC (E) cohorts with respect to SAC3D1 gene expression (red: all patients, green: alcohol consuming patients, blue: Hepatitis B patients, and light blue: Hepatitis C patients). C-index values are shown at the bottom right of graphs (A and C). AUC values at 5 years are shown at the bottom right of graphs (B and D).

