Figure 7.
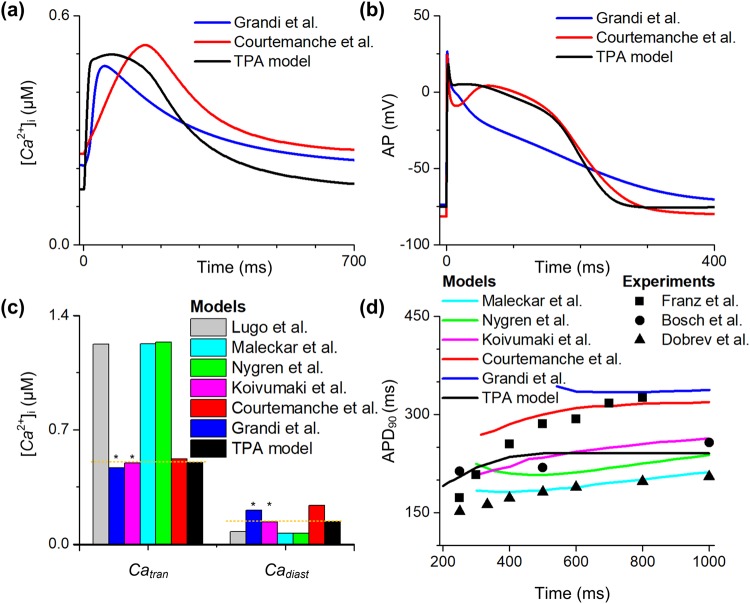
Comparison of the TPA model with different human atrial models. The myocyte was stimulated at a pacing frequency of 1 Hz. The intracellular calcium ([Ca2+]i, (a)) and action potentials (AP, (b)) of Grandi et al. model40 (blue lines), Courtemanche et al.model42 (red lines) and the current model (black lines) are shown. (c) The amplitude of calcium transient (Catran) and diastolic calcium concentration (Cadiast) (black bar) are compared to simulation results of Lugo et al. model (gray bar)66, Maleckar et al. model67 (cyan bar), Nygren et al. model68 (green bar), Koivumaki et al. model64 (magenta bar), Courtemanche et al. model (red bar) and Grandi et al. model (blue bar). (d) The action potential duration at 90% repolarization (APD90) restitution curve (black lines) is compared to simulated APD90 restitution of Maleckar et al. model (cyan lines), Nygren et al. model (green lines), Koivumaki et al. model (magenta lines), Courtemanche et al. model (red lines) and Grandi et al. model (blue lines), and experimental data of Franz et al.69 (▪), Bosch et al.43 (•) and Dobrev et al. (▲)70. All the data are adapted from Wilhelms et al.71.

