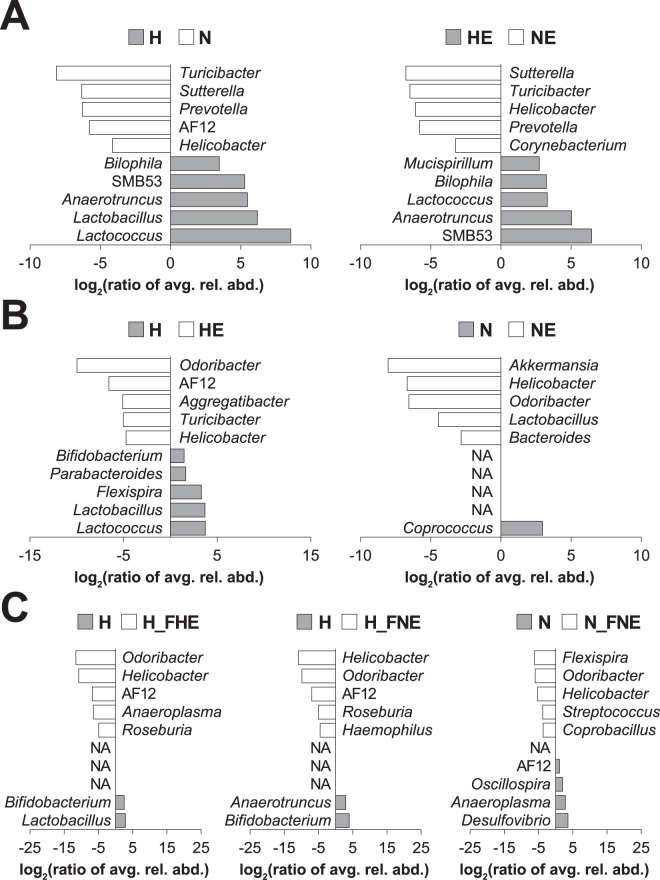
Figure 5.
Top genera based on LEfSe and stratified by diet, exercise and FMT. Based on the genera relative abundance after FMT (i.e., week 24), the top 5 genera in each LEfSe comparison (p < 0.05) were obtained. The log-2 ratio of genus average relative abundance is presented as x-axis and genus names are presented as inlet. (A) Genera in LEfSe comparisons stratified by diet. (B) Genera in LEfSe comparisons stratified by exercise. (C) Genera in LEfSe comparisons stratified by FMT. NA, not applicable; avg., average; rel., relative; abd., abundance.

