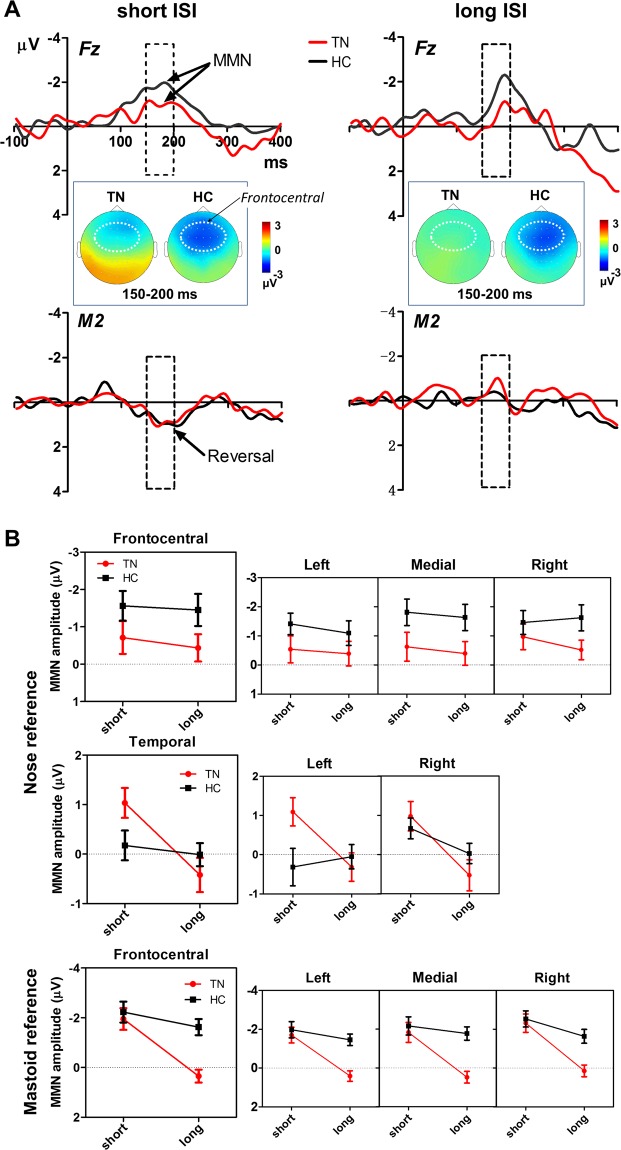
Figure 2.
Comparison of MMN amplitudes between TN patients and HCs in different ISI conditions. (A) MMN grand average waveforms at frontal and temporal regions shown with scalp topographical maps. The dashed boxes superimposed on waveforms mark the MMN time window (150–200 ms). Scalp topographies of MMN amplitude are shown in this time window, with a white dotted oval indicating the frontocentral ROI. Note the typical negative deflection at Fz and a polarity reversal (positive deflection) at the mastoid. (B) Nose-referenced and mastoid re-referenced MMN data at frontocentral and temporal regions. Reduction of MMN amplitude with ISI prolongation was more pronounced in the TN group than in the HC group. Error bars indicate standard errors.

