Figure 4.
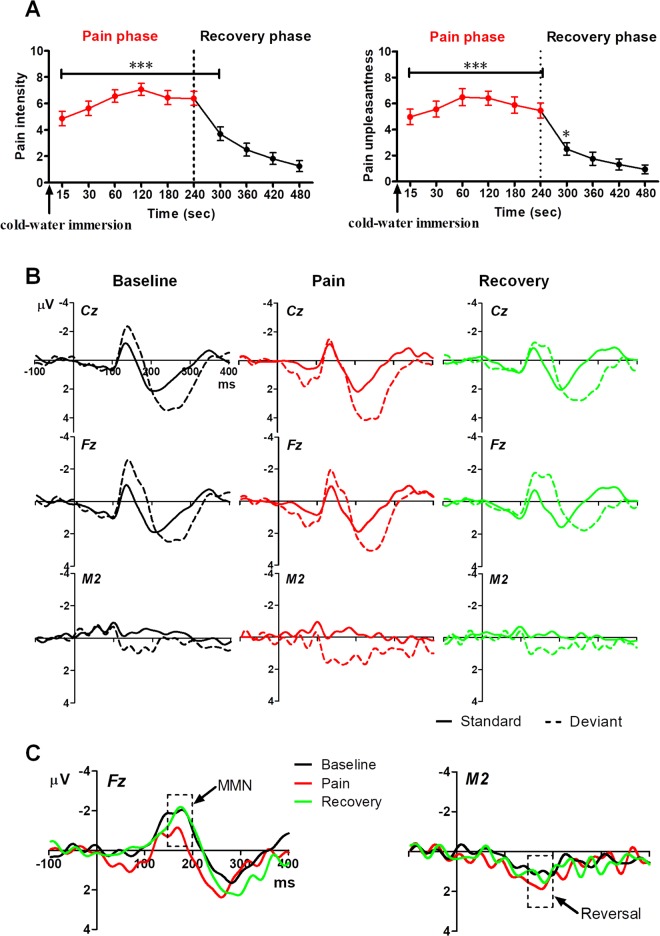
ERPs produced in response to standard and deviant tones and MMN grand average waveforms in Experiment 2. (A) Ratings of pain intensity and unpleasantness in cold-induced pain (red) and recovery (black) phases. *P < 0.05, ***P < 0.001, compared to ratings at 480 s. (B) Grand average waveforms generated in response to standard and deviant tones in the baseline (black), cold pain (red), and recovery (green) periods. (C) MMN grand average waveforms in different experimental phases. The dashed boxes superimposed on the waveforms mark the time window of the MMN (150–200 ms).

