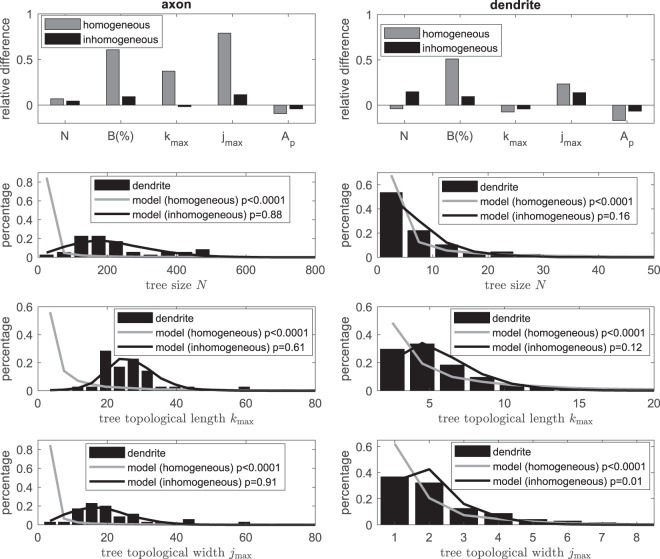
Figure 5.
Comparison between actual neuron data and model. Top two panels show relative difference on quantities including tree size N, percentage of B-type branching nodes B(%), tree topological length kmax and width jmax as well as tree asymmetry A from (in)homogeneous modelling to those measured from actual axonal (left) and dendritic (right) trees respectively. Bottom panels show distributions on tree size N and topological shape parameters (kmax and jmax). Two-sample Kolmogorov-Smirnov test is used to compare between distributions from actual axonal (left) and dendritic (right) trees and virtual trees generated using the (in)homogeneous model; p values are indicated for each comparison. The imhomogeneous model uses the best fitted exponential decay with non-zero plateau of the branching probability given in Fig. 6.

