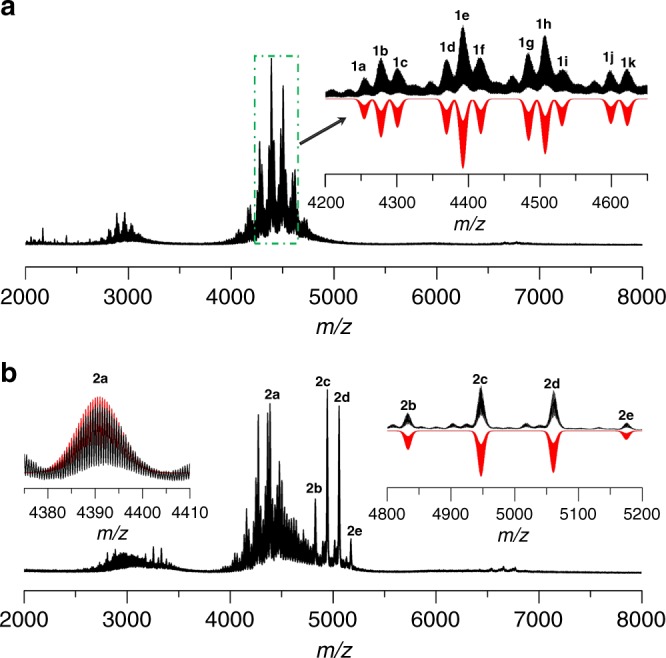
Fig. 4.

ESI-MS. a Positive ion mode ESI-MS of the crystals of SD/Ag44 dissolved in dichloromethane. Inset: The zoom-in mass spectrum of experimental (black line) and simulated (red line) isotope patterns for each labeled species. b Positive ion mode ESI-MS of the crystals of SD/Ag50 dissolved in dichloromethane. Insets: The zoom-in mass spectrum of experimental (black lines) and simulated (red lines) isotope patterns for each labeled species
