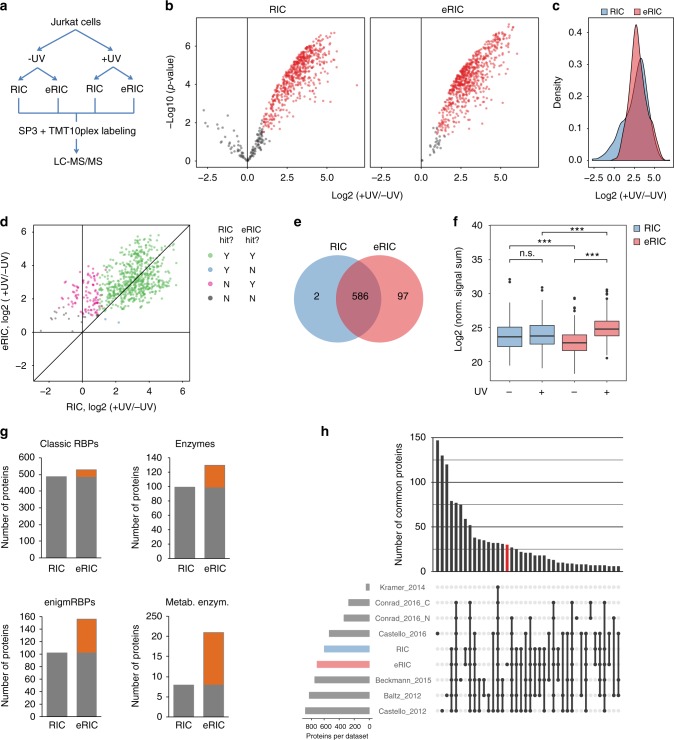
Fig. 3.
Superior performance of eRIC in RBP detection. a Scheme of the workflow of the direct comparative analysis of eRIC and RIC. Proliferating Jurkat cells were irradiated or not, lysed, and lysates equally split for eRIC or RIC analyses. Concentrated eluates were subjected to SP3, TMT-labeled, and analyzed by MS. b Volcano plots displaying the log2-fold change (FC) in irradiated (+UV) over non-irradiated (−UV) samples (x axis) and the p values (y axis) of the proteins identified by eRIC (right) and RIC (left). Proteins with FDR < 0.05 (moderated t test) and FC ≥ 2 were considered significantly enriched and are depicted in red. c Density of log2-FC between irradiated and non-irradiated samples of proteins identified by eRIC (red) and RIC (blue). Note the lack of enrichment over background of many proteins in RIC but not eRIC samples (leading left area of the blue curve). d Scatter plot comparing the averaged log2-FC in irradiated over non-irradiated samples of proteins detected by eRIC (y axis) and RIC (x axis). Hits recovered by both eRIC and RIC are displayed in green, hits unique to eRIC or RIC in magenta and blue, respectively, and proteins identified as background by both methods are shown in black. e Venn diagram comparing the number of hits identified by eRIC and RIC. f Normalized signal sum in irradiated and non-irradiated samples of the 97 hits exclusively identified by eRIC. ***p < 0.001 (Wilcoxon signed-rank test); n.s.: not significant. Center lines represent medians, box borders represent the interquartile range (IQR), and whiskers extend to ±1.5× the IQR; outliers are shown as black dots. g Number of known RBPs, enzymes, enigmRBPs4, and metabolic enzymes identified by eRIC and RIC. Orange boxes represent the hits exclusive to eRIC. h UpSet plot showing the number of common proteins (i.e., intersections) between the eRIC and RIC experiments presented here or in previously published RBP datasets. Conrad_2016_C and _N refers to cytoplasmic and nuclear datasets3, respectively. Data correspond to two biologically independent experiments

