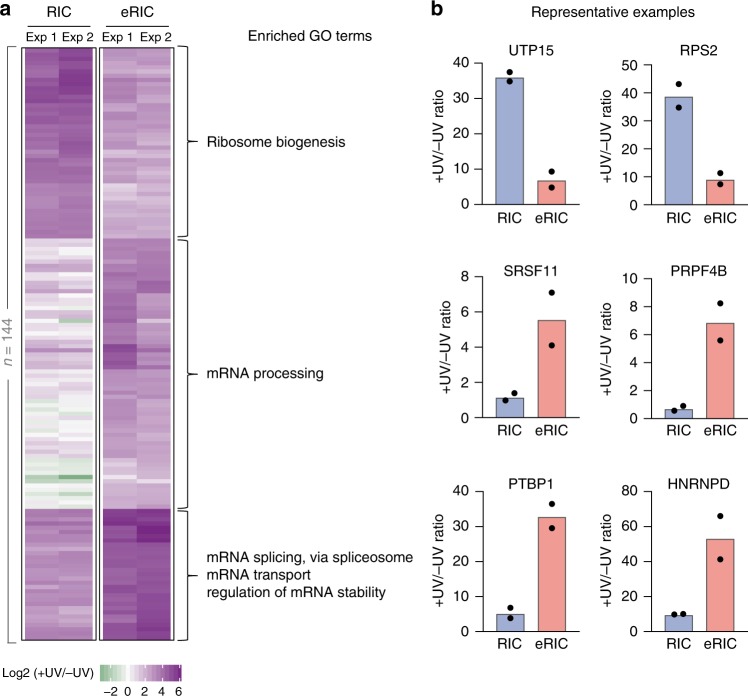
Fig. 4.
Differential RBP enrichment with eRIC. a Unsupervised clustering and GO analysis of proteins whose enrichments in irradiated (+UV) over non-irradiated (−UV) samples differ significantly between eRIC and RIC (FDR < 0.05 (moderated t test) and FC > 2, 144 proteins). Three main clusters are observed that comprise RBPs preferentially recovered by RIC (top) or eRIC (middle and bottom). Note that proteins in the middle and bottom clusters markedly differ in their enrichment over background in RIC samples. Biological process GO terms enriched for each cluster are shown. Upper: “ribosome biogenesis” (−log10 (p value) = 39.95; enrichment = 40.6), middle: “mRNA processing” (18.36; 14.85), bottom: “mRNA splicing via spliceosome” (33.48; 52.4), “mRNA transport” (8.52; 30.85) and “regulation of mRNA stability” (4.04; 17.08) (Fisher’s Exact with FDR multiple test correction). b Fold change in irradiated over non-irradiated samples of representative example RBPs captured by eRIC and RIC. Data correspond to two biologically independent experiments (a, b); in b, data are shown as mean

