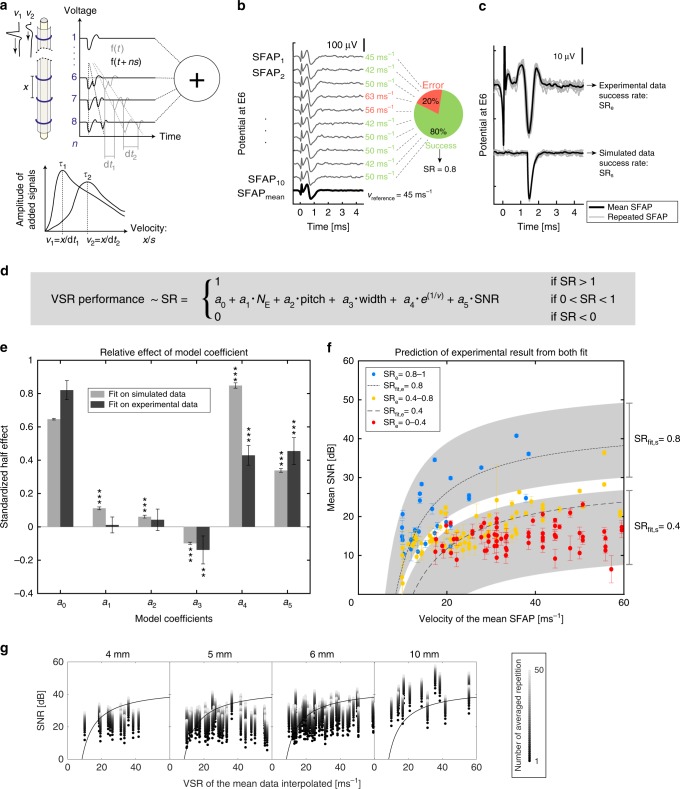
Fig. 2.
Prediction of VSR algorithm performance. a VSR principle, adapted from24. SFAP are traveling along the nerve recorded by n electrodes spaced by x (gray line). The recordings on each electrode are shifted by ns (black line), where s corresponds to the propagation delay between two electrodes (multiple of the sampling frequency). For each value of s, all recordings are summed. The sum becomes constructive when s matches dt (alignment of propagating SFAP). b Example of calculation of the SR. Each simulated or recorded SFAP is elicited 10 times and averaged. The SR is the proportion of SFAP with a calculated velocity equal to the velocity of the mean SFAP (see Eq. 1). c Example of recorded SFAP repetitions and mean (experimental data) and its simulated version (amplitude = 55 µV, SNR = 30 dB, width = 0.22 ms, and velocity = 13.3 ms–1). d Linear model resulting from preliminary simulation (see Supplementary Methods). The model terms are function of the number of electrode (NE), the electrode pitch (pitch), the SFAP width at half prominence (width), the SFAP velocity (e1/v) and the maximum SNR along the channel (SNR). The model coefficients ai were fitted to experimental and simulated data. e Relative effect of each model terms on the SR. Model coefficients, expressed as standardized half effect, were computed from simulated and experimental data. Error bar: 95% confidence interval. Significance (ANOVA, α = 0.05, Supplementary Methods 3): ***p < 0.001, **p < 0.01. f Experimental SR (SRe), as well as SR predictions from our model fitted on experimental (SRfit,e, dashed line, for width = 0.03 ms, NE and pitch: n/a) and simulated data (SRfit,s, gray area, width = 0.03, NE = 3-8, pitch = 1.33–0.67 mm). Error bar: standard deviation (n = 10). g SR as a result of SNR, velocity and channel length. Black dot shows experimental results and lighter dots show the calculated increase of SNR in function of signal averaging. The black line (SRe = 0.8) delimits the region for “safe” velocity calculation (above line)

