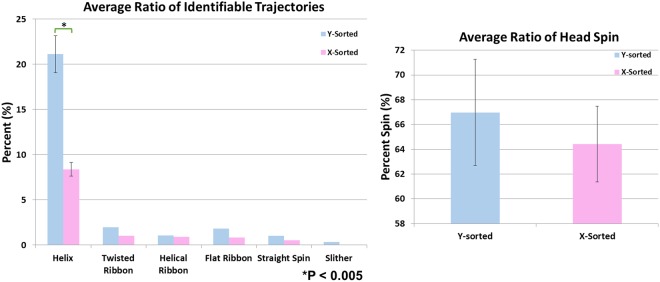
Figure 4.
(a) The mean ratio of the 3D swimming trajectory categories across three separate experiments for both X-chromosome bearing (pink) and Y-chromosome bearing (blue) bovine sperm cells shows a statistically significant difference in the helix mode swimming category (P < 0.005). (b) The mean ratio of head spin across three separate experiments is similar for both sperm populations. The bars represent the standard deviation within the three separate experiments.

