Figure 7.
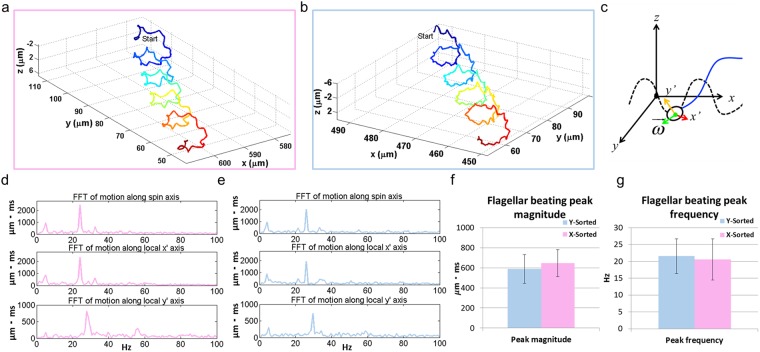
(a,b) A helical sperm trajectory from an X-sorted (enclosed in pink) and Y-sorted (enclosed in blue) sperm, respectively. (c) The local coordinate system used to analyze the true 3D kinematic of the flagellar beating from the perspective of an observer sitting on and traveling with the sperm head. The thicker side of the sperm head corresponds to the x’-axis, the thinner side corresponds to the y’-axis and the -axis extends from the head-flagellum junction towards the tip of the head. (d,e) The frequency domain analysis of the motion of a flagellar node ~40 µm away from the head-flagellum junction (in arc-length) for the helical trajectories shown in (a,b) respectively. The dominant beating frequency was observed to be ~24 Hz for the X-chromosome bearing sperm and ~26 Hz for the Y-chromosome bearing sperm with similar amplitudes. (f,g) The peak beating amplitude and frequency was observed to be similar for both sperm populations.

