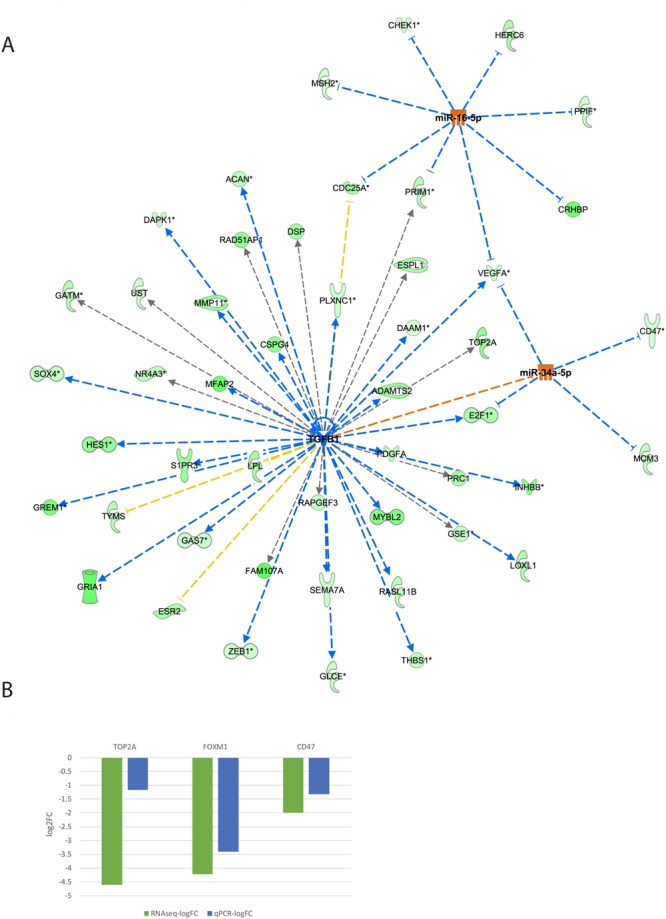
Figure 4.

(A) The resultant DE miRNAs were analyzed through the use of IPA (Ingenuity Pathway Analysis, QIAGEN Inc., https://www.qiagenbioinformatics.com/products/ingenuitypathway-analysis)19 to examine the crosstalk between the TGFB1 signaling pathway and miR-34a and miR-16a-5p (seed of miR-424-5p). We revealed a number of genes and pathways, most notably VEGFA, that are reciprocally regulated by these negatively correlated transcription regulators. (B) Total mRNA was purified from CCs denuded from GV COC and M2 COC aspirated during IVF procedures. The mRNAs were subjected to qPCR in duplicate with the examined genes and ACTB primers. Gene expression was calculated relative to the ACTB level in the same sample and expression levels were compared using Student’s t-test. The difference reached p = 0.006 for FOXM1, p = 0.01 for TOP2A and p = 0.08 for CD47. RNAseq (green) and qPCR (blue) results are presented as log2-fold change between COC M2 and COC GV samples.
