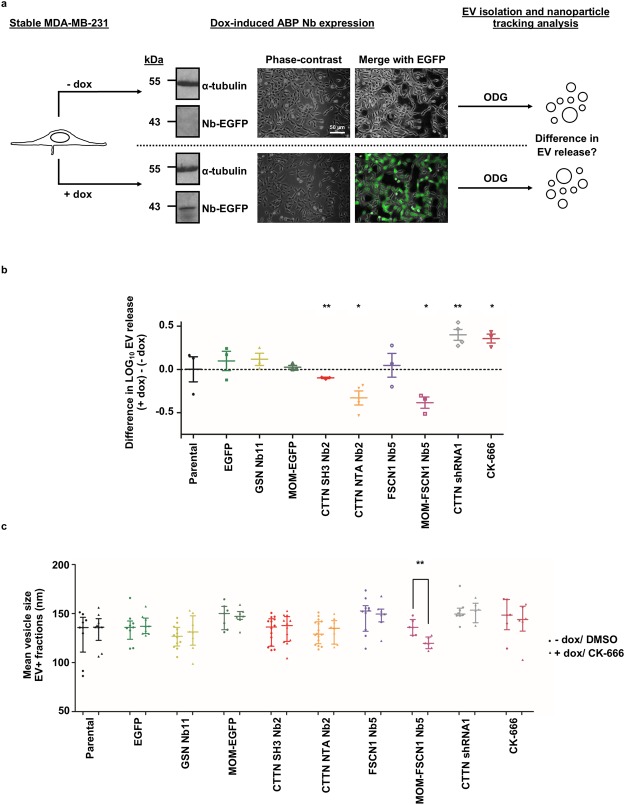
Figure 2.
Nanobodies interfering with CTTN function or FSCN1 localization induce a decrease in EV release but have dissimilar effects on mean EV size. (a) EVs of MDA-MB-231 with dox-inducible EGFP-tagged nanobody (Nb) expression (24 h, 500 ng/ml dox) were isolated by means of ODG centrifugation and were subsequently quantified by nanoparticle tracking analysis. Scheme illustrates induction of ABP nanobody expression and pursued flow chart. Inducible nanobody expression is illustrated using GSN Nb11 MDA-MB-231. α-tubulin was used as a loading control. For reasons of clarity and conciseness, blots were cropped to the bands of interest. Full-length blots are presented in Supplementary Figure S10. (b) Graphs represent mean difference in LOG EV release (LOG10 particles/cell) between nanobody expressing (+dox) and non-expressing (−dox) cells with SEM (n 3). P0.05-value was determined by a ratio paired t test. Neither dox addition as such (p = 0.9914), nor EGFP (p = 0.4701) or MOM-EGFP (p = 0.3261) expression significantly alter EV release. Expression of a nanobody against the actin severing protein gelsolin (GSN Nb11) does not significantly affect EV release (p = 0.2363). EV release is significantly reduced by CTTN SH3 Nb2 and CTTN NTA Nb2 expression (p = 0.0062 and p = 0.0397, respectively). FSCN1 Nb5 does not alter EV release (p = 0.7624). Conversely, delocalization of FSCN1 towards the mitochondria (MOM-FSCN1 Nb5) significantly reduces EV release (p = 0.0276). On the other hand, CTTN knockdown by means of RNAi (CTTN shRNA1) or inhibition of the ARP2/3 complex by CK-666 (100 µM, 24 h) significantly induces EV release (p = 0.0204 and p = 0.0080, respectively). *P ≤ 0.05 and **P ≤ 0.01. (c) Quantification of mean vesicle size by nanoparticle tracking analysis. Dots or triangles represent mean vesicle size of single EV+ fraction measurements (n ≥ 6 each condition) of non-expressing (−dox)/DMSO-treated versus expressing (+dox)/CK-666-treated MDA-MB-231 cells, respectively. Graphs represent median vesicle size with interquartile range. P0.05-value was determined by a Mann-Whitney rank sum test. Only MOM-FSCN1 Nb5 expression significantly reduces mean EV size (p = 0.0043). **P ≤ 0.01.

