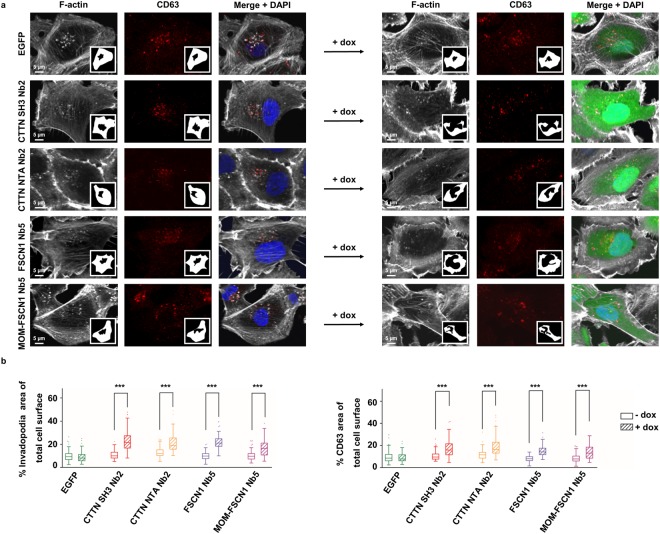
Figure 5.
Nanobodies interfering with CTTN and FSCN1 function or FSCN1 localization affect invadopodia and CD63+ vesicle pattern determination. (a) Representative confocal images of MDA-MB-231 breast cancer cells stably expressing ABP nanobodies (right panels, 24 h induction with 500 ng/ml dox) and without nanobody expression (left panels). All nanobodies induce an increase in perinuclear F-actin (Acti-Stain 670 phalloidin) spread area (first panels on the left versus first panels on the right). Nanobody expression has a similar effect on the CD63 pattern (middle panels on the left versus middle panels on the right). EGFP expression as such neither alters the F-actin pattern, nor the CD63 pattern (top panels left versus top panels right). Extracted F-actin/invadopodia or CD63 areas are shown in the insets. Nuclei (blue) were visualized by means of DAPI and nanobodies (green) are intrinsically fluorescent via their EGFP-tag. (b) Quantification of invadopodia (left) and CD63 (right) spread area by means of Acti-Stain 670 phalloidin and CD63 staining, respectively, in nanobody-expressing (+dox, 24 h induction with 500 ng/ml dox) versus non-expressing (−dox) MDA-MB-231 cells. Tukey boxplots represent quantification of the ratio of total perinuclear phalloidin area to total cell area (left) or the ratio of total CD63 area to total cell area (right). P0.05-value was determined by a Mann-Whitney rank sum test and n ≥100 cells were quantified for each boxplot. The boxplot data corroborate the microscopy data in (a). P-values phalloidin area: 0.1643 (EGFP), <0.0001 (CTTN SH3 Nb2, CTTN NTA Nb2, FSCN1 Nb5 and MOM-FSCN1 Nb5). P-values CD63 area: 0.5489 (EGFP), <0.0001 (CTTN SH3 Nb2, CTTN NTA Nb2, FSCN1 Nb5 and MOM-FSCN1 Nb5). ***P ≤ 0.001.

