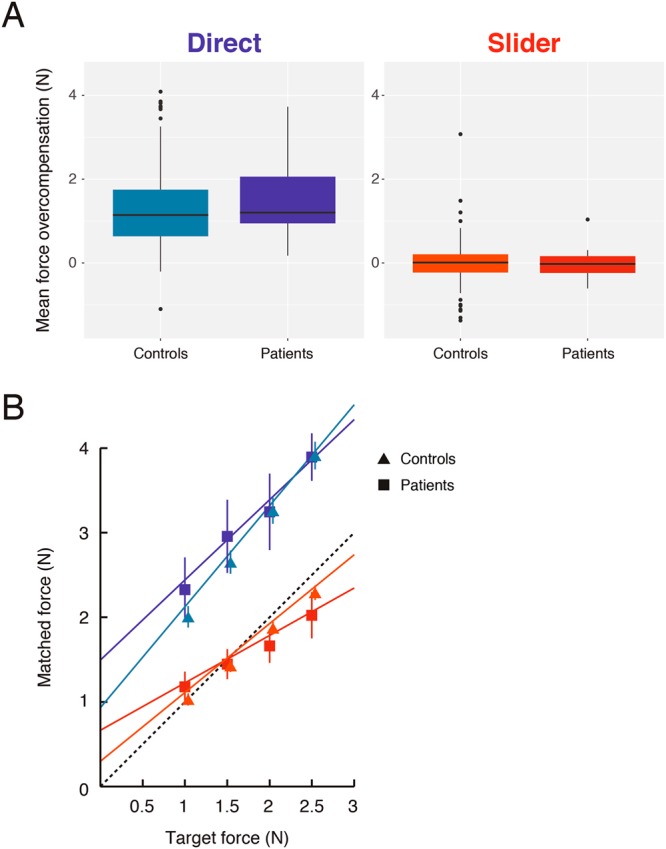
Figure 2.

Differences in sensorimotor attenuation between PD patients and controls. (A) Standard boxplots showing the distribution of mean force overcompensation values across all patients and controls in the Direct (shades of blue) and Slider (shades of red) conditions. Positive value indicates sensory attenuation. (B) Mean regression plots of matched versus target force in the Direct and Slider conditions for both groups. Colour scheme is the same as in (A). Dashed line indicates the line of equality. Error bars indicate ± 2 standard error of group mean. Control data points and error bars are offset by 2 pixels for illustration.
