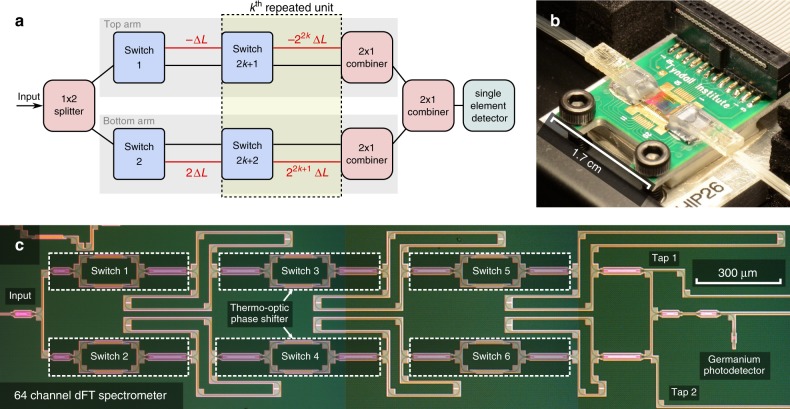
Fig. 1.
Images and schematics of the dFT architecture. a Block diagram illustrating the generic structure of a dFT spectrometer with j switches and K=j/2 − 1 repeated stages indexed by ; b photo of the fully packaged, plug-and-play dFT spectrometer with standard FC/PC fiber interface and a ribbon cable for control and signal read-out; c top-view optical micrograph of the 64-channel dFT spectrometer after front-end-of-line silicon fabrication, showing the interferometer layout, the thermo-optic switches and waveguide-integrated germanium photodetector

