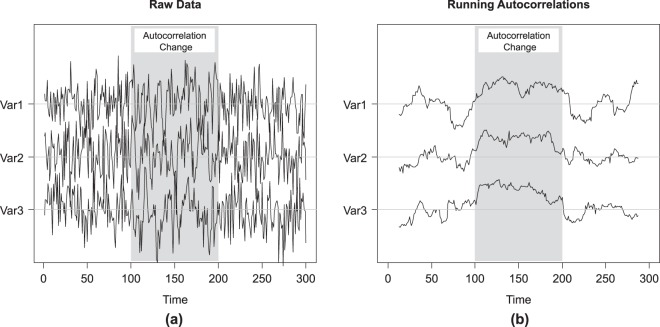
Figure 1.
The raw scores (a) and running autocorrelations (b) for the toy example. A trivariate time series comprised of 300 time points was simulated from a multivariate normal distribution with zero means, unit variances and zero cross-correlations. Three phases are simulated with 100 time points each. In Phase 1, all autocorrelations are equal to zero. In Phase 2, a change was introduced such that all autocorrelations shifted to 0.50. In Phase 3, all autocorrelations reverted to zero. The different phases are indicated by the varying background shading.

