
Figure 6.
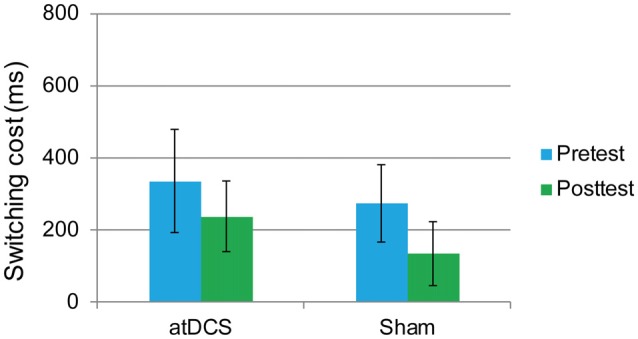
The plot displays the mean switching cost of the RT in each group (anodal transcranial direct current stimulation and sham transcranial direct current stimulation) at pretest and posttest. Error bars represent standard errors of the mean. atDCS, anodal transcranial direct current stimulation.