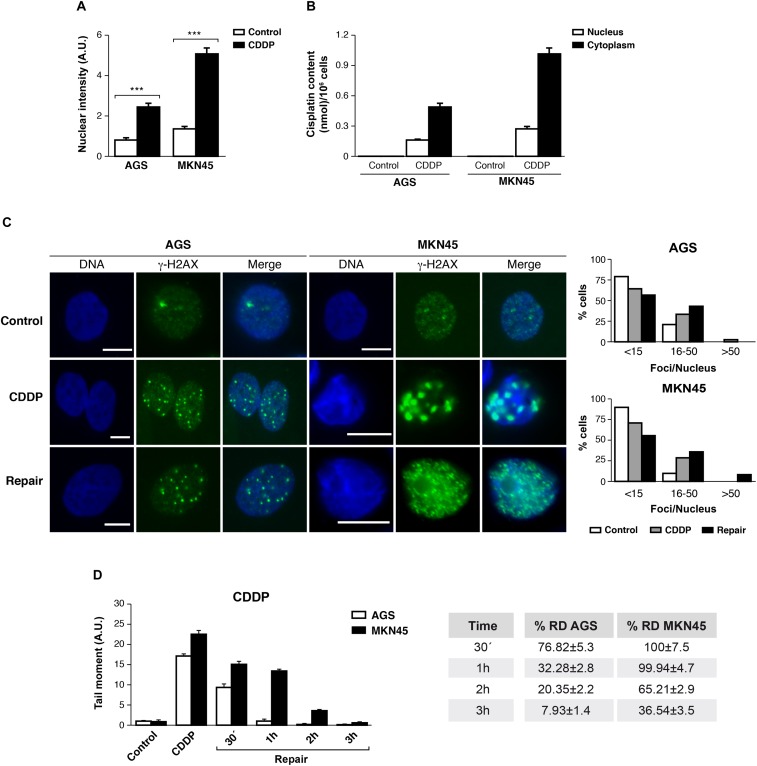
FIGURE 3.
DNA repair is impaired in MKN45 cells. (A) Graph represents nuclear fluorescent intensity of DNA adducts formed after treating AGS and MKN45 with CDDP (10 μg/ml). Control cells (white bars) were untreated, or treated CDDP (black bars) for 3 h. DNA adducts were detected by using anti-(Pt-DNA) antibody. (B) Subcellular distribution of CDDP in GC cells after 3 h of 10 μg/ml treatment. White bars represent the CDDP content in nucleus and black bars in cytoplasm. Data are expressed as the mean values of the metal (nmol cisplatin) content in the nucleus or cytoplasm per million cells obtained in three different experiments. (C) AGS and MKN45 cells were treated as in panel (A), and they were allowed to recover in normal media for 1 h before harvesting. γ-H2AX foci were detected by Immunofluorescence, using DAPI to stain nuclear DNA. Graphs represent the percentage of nucleus within less than 15, between 15 and 50 and more than 50 γ-H2AX/nuclei for each condition. (D) Graphs represent the mean tail moment (TM) measured in at least 50 cells per duplicated in each condition after CDDP treatment (10 μg/ml). Tables present the percentage of residual damage (RD) after the repair period. ∗∗∗p < 0.001.

