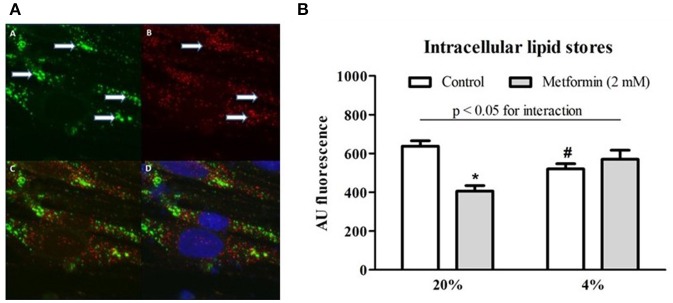
Figure 5.
Lipid co-localization imaging and total intracellular lipid content. (A) A representative example of a microscope image of lipids stained with BODIPY 493/503 (green) forming distinct vesicular structures marked by arrows (A), staining (red) for peroxisome-specific protein PMP70 (B), merged image of lipid and PMP70 staining (C) and merged image of lipid, PMP70, and nuclei staining (blue) with Hoechst 33258 (D). (B) Total lipid content during hypoxia and after metformin treatment The effect of hypoxic exposure (4% O2) and 7-day metformin administration on total lipid content in differentiated L6 myotubes. *p < 0.05 for comparison with vehicle-treated cells, #p < 0.05 for comparison with control exposures (20% O2), n = 6. Two-way ANOVA was used to explore interaction between exposure to hypoxia and metformin treatment.

