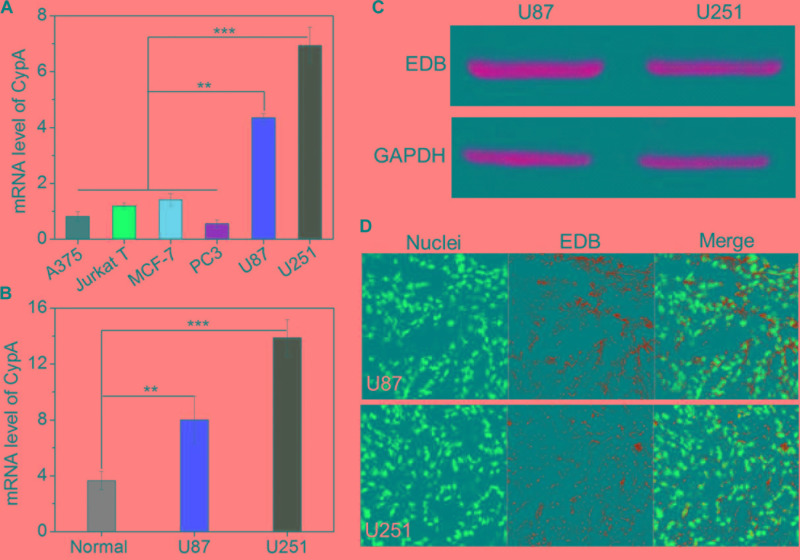
FIGURE 3.
(A) The mRNA level of CypA in the skin melanoma cells (A375), Jurkat leukemic T cells, prostate cancer cells (PC3), breast cancer cells (MCF-7), and glioma cells (U87 and U251). (B) The mRNA level of CypA in the normal brain tissues and GBM xenograft tumor tissues of nude mice. (C) Western blot analysis of the EDB expression in the glioma cells (U87 and U251). (D) Immunofluorescence analysis of the EDB expression in the GBM xenograft tumor tissues of nude mice. The nuclei and EDB were stained with blue and green fluorescence, respectively. ∗∗P < 0.01; ∗∗∗P < 0.001.

