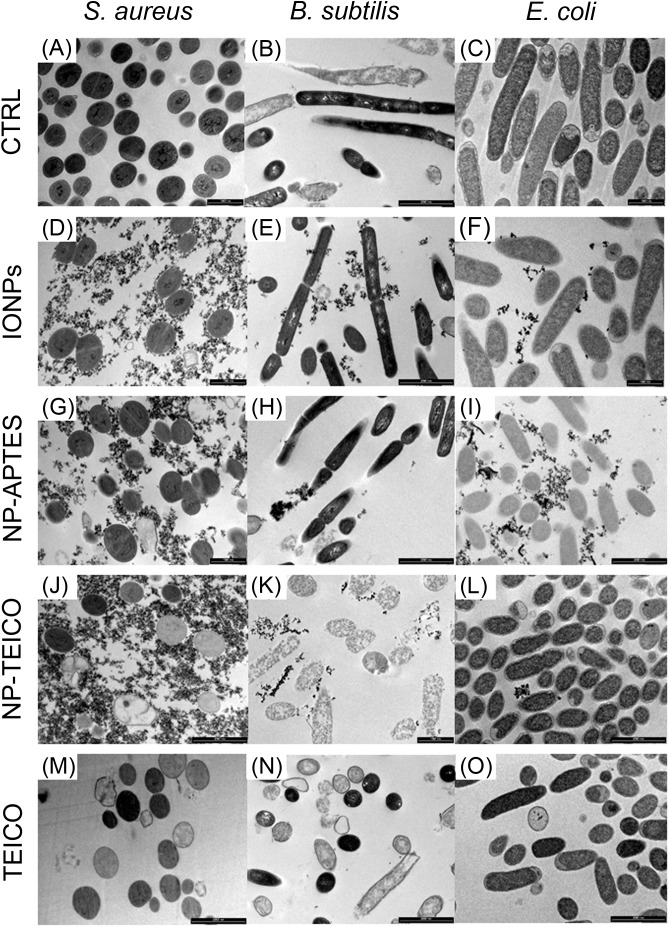
FIGURE 7.
TEM images of S. aureus ATCC 6538P [first column on the left: (A,D,G,J,M)], B. subtilis ATCC 6633 [middle column: (B,E,H,K,N)], and E. coli ATCC 35218 [column on the right: (C,F,I,L,O)] cells in the absence and presence of different NP preparations and of teicoplanin. (A–C) untreated cells; (D–F) cells treated with IONPs; (G–I) cells exposed to NP-APTES; (J–L) cells exposed to NP-TEICO; (M–O) cells treated with teicoplanin. Scale bars: 1 μm.

