
Figure 3.
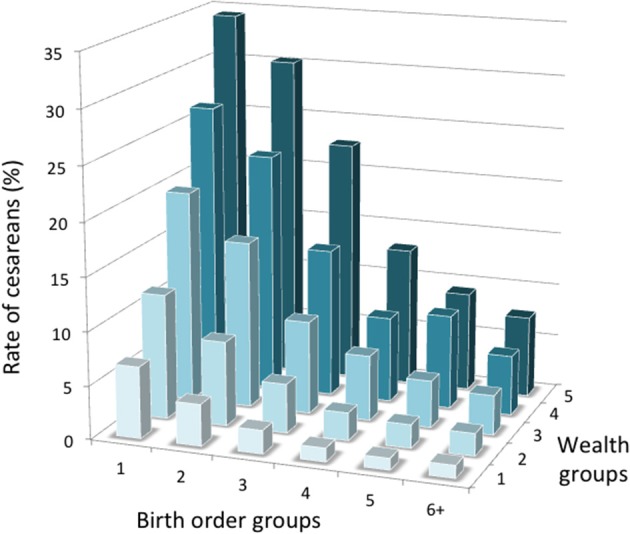
Interactive associations of birth order and wealth category with the rate of C-section in the 2015–1016 survey (5 = wealthiest). Numbers per group are given in Table S3.
Official websites use .gov
A
.gov website belongs to an official
government organization in the United States.
Secure .gov websites use HTTPS
A lock (
) or https:// means you've safely
connected to the .gov website. Share sensitive
information only on official, secure websites.
Interactive associations of birth order and wealth category with the rate of C-section in the 2015–1016 survey (5 = wealthiest). Numbers per group are given in Table S3.