Figure 5.
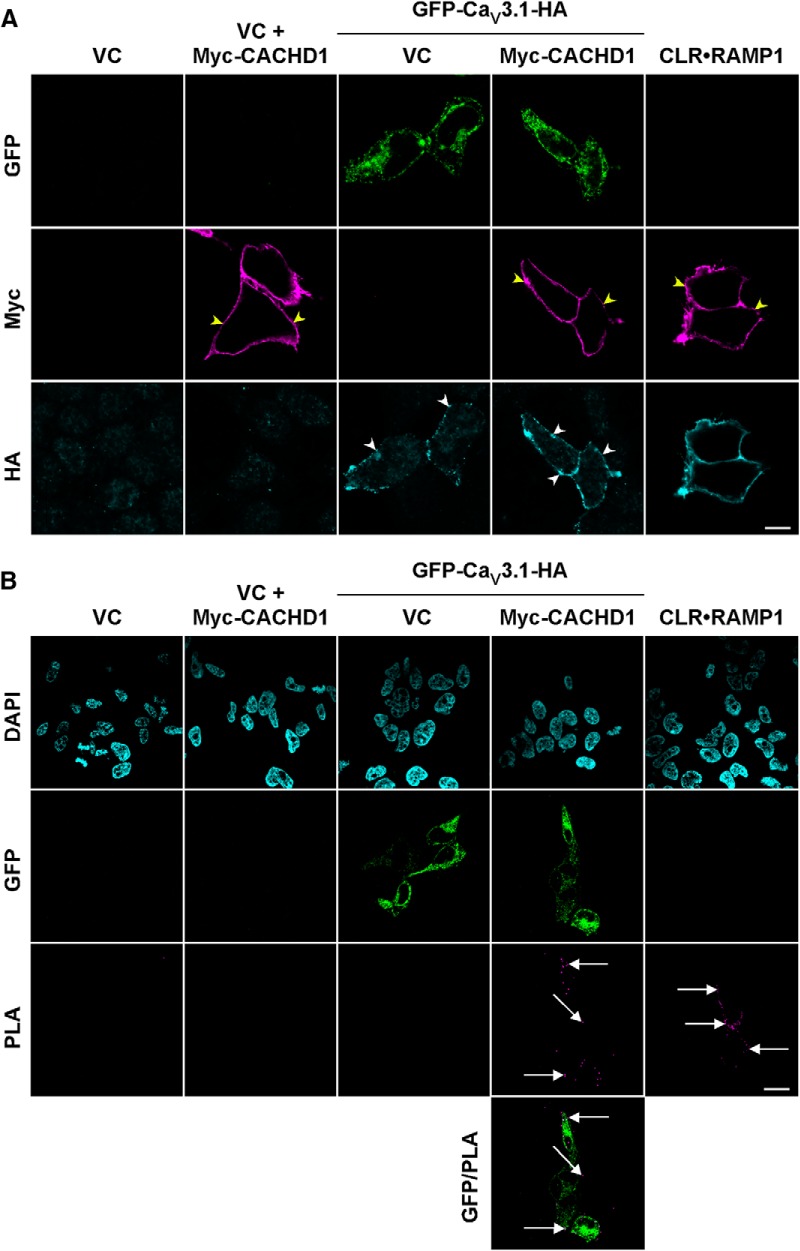
CaV3.1 and CACHD1 are present at the cell surface and are in close proximity. Live HEK cells expressing empty vector (VC), VC + Myc-CACHD1, GFP-CaV3.1-HA + VC, Myc-CACHD1 + GFP-CaV3.1-HA, or CLR-RAMP1 (positive control) were incubated with antibodies to HA and Myc, washed, and fixed. A, Cells were then incubated with appropriate secondary antibodies and immunoreactive proteins localized by immunofluorescence and confocal microscopy. In HEK-VC cells, no signals for GFP, HA, or Myc were detected indicating specificity of detection. HA signals (white arrowheads) were detected only in cells expressing GFP-CaV3.1-HA (as determined by the GFP signal) and CLR-RAMP1. Similarly, Myc signals (yellow arrowheads) were detected only in cells expressing Myc-CACHD1 and CLR-RAMP1. Scale bar, 10 μm. B, After the proximity ligation assay, no signals were detected in cells expressing empty vector or in cells expressing only Myc-CACHD1 or GFP-CaV3.1-HA. In contrast, PLA signals were detected in cells expressing Myc-CACHD1 + GFP-CaV3.1-HA (arrows) and CLR-RAMP1 (arrows). Single optical sections are shown except for the PLA panel (CLR-RAMP1 excluded), where five optical sections are merged, two above and two below (0.5 μm increments) from the optical sections shown in the GFP/DAPI panel. Scale bar, 20 μm. All images are representative of n = 3 experiments. The figure is supported by analysis of cell-surface CACHD1 construct expression studies (Figure 5-1).

