Figure 8.
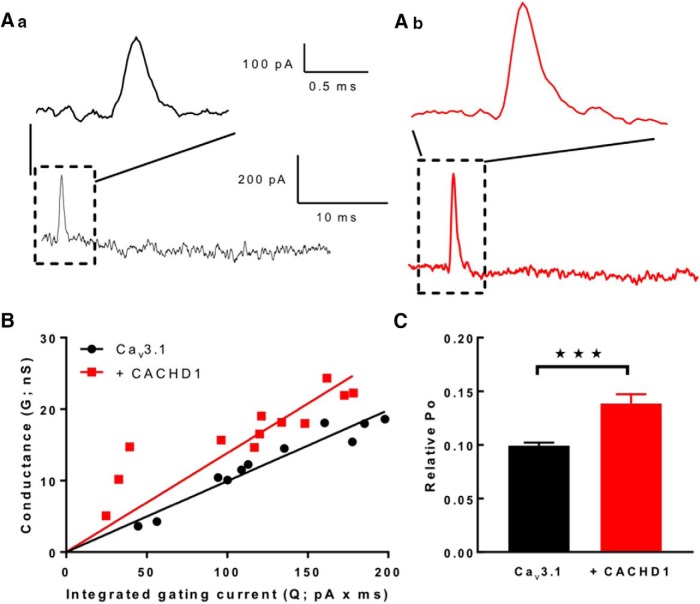
CACHD1 expression increases CaV3.1 gating currents and Po. Aa, Ab, Representative gating currents recorded from CaV3.1 (Aa) and CaV3.1 + CACHD1 (Ab) at the observed reversal potential. Expanded time scale illustrates the increase in the area under the gating current for CACHD1-expressed cells. B, Conductance vs gating current plot for multiple cells. Line represents linear regression to data points. The slopes (Gmax/Qmax) were significantly different (p = 0.0004, least-squares fits compared using extra sum of squares F test; CaV3.1: 0.09 ± 0.003, n = 10; CaV3.1 + CACHD1: 0.14 ± 0.090, n = 11). C, Plot showing the slopes (i.e., relative Po) and SEM for fits shown in B (***p < 0.001).

