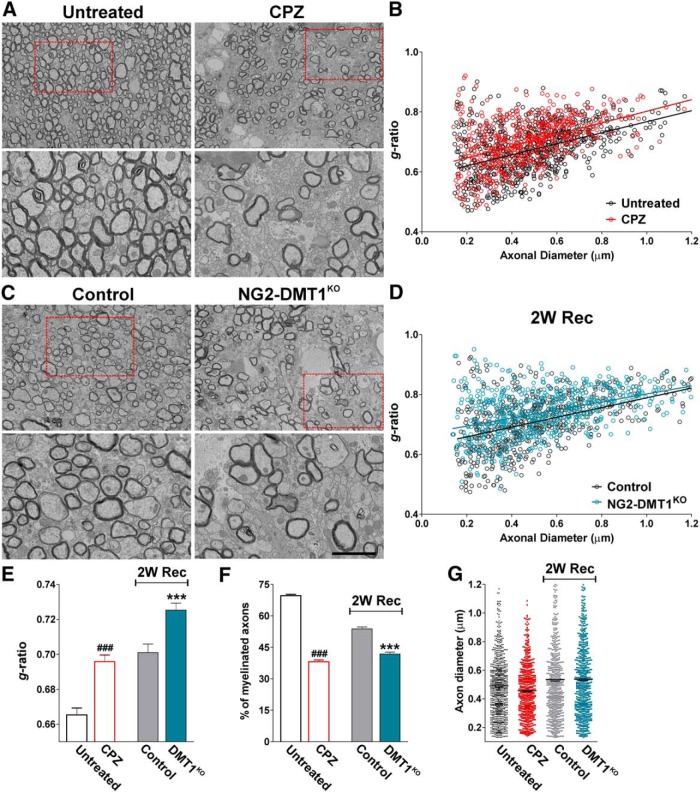
Figure 11.
Electron microscopy of the NG2-DMT1KO corpus callosum during remyelination. A, C, Electron micrographs of axons in the corpus callosum of untreated animals (untreated), mice treated with cuprizone for 7 weeks (CPZ) and control and NG2-DMT1KO mice at 2 weeks of recovery (2W Rec). Scale bar: (in C) top, 8 μm, bottom, 2 μm. B, D, Scatter plot of g-ratio values. The lines represent the regression equation with 95% confidence intervals. Untreated: r2, 0.2500; slope, 0.1841; 1/slope, 5.431; F, 257.4; CPZ: r2, 0.2024; slope, 0.1942; 1/slope, 5.151; F, 146.9; Control: r2, 0.2971; slope, 0.1627; 1/slope, 6.145; F, 274.7; NG2-DMT1KO: r2, 0.1878; slope, 0.1338; 1/slope, 7.476; F, 142.5. E, Mean g-ratio values. Exact p values from left to right: <0.0001; 0.0001. F, Percentage of myelinated axons. Exact p values from left to right: <0.0001; <0.0001. G, Mean axonal diameter of myelinated axons. Exact p values from left to right: 0.0672; 0.8373. Comparisons between experimental groups were made by one-way ANOVA followed by Bonferroni's multiple-comparison test. Values are expressed as the mean ± SEM. Four animals per experimental group and 150 fibers per animal were analyzed. ###p < 0.001 vs untreated; ***p < 0.001 vs control.

