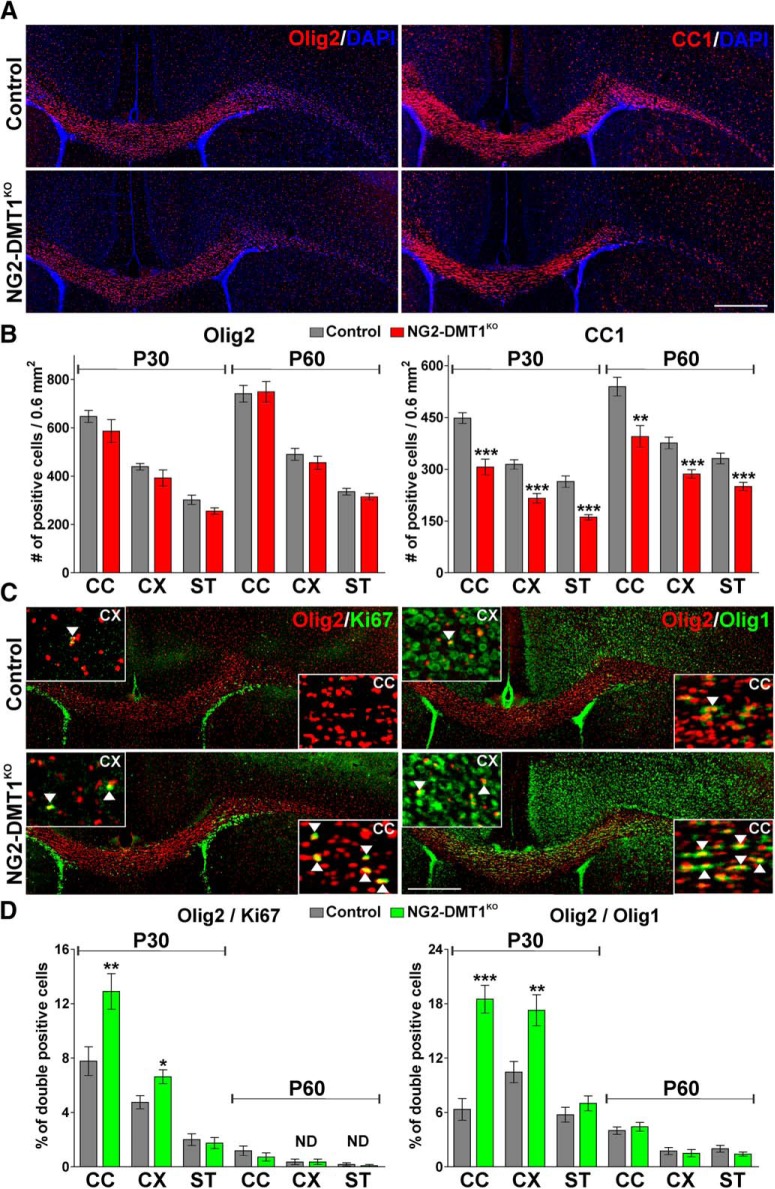
Figure 7.
A decreased number of mature OLs in the NG2-DMT1KO mouse. A, C, Representative coronal sections of control and NG2-DMT1KO brains at P30 immunostained for Olig2, CC1, and the combination of Olig2/Ki67 and Olig2/Olig1. Scale bar, 180 μm. Arrowheads in high-magnification insets indicate examples of double-positive cells that were selected for the analysis. B, D, The number of Olig2 and CC1-positive cells and the percentage of Olig2/Ki67 and Olig2/Olig1 double-positive cells was quantified in the central area of the corpus callosum (CC), in the cortex (CX), and in the striatum (ST) at P30 and P60. Exact p values from left to right: Olig2: 0.2738; 0.2125; 0.0604; 0.8876; 0.3629; 0.2998; CC1: <0.0001; <0.0001; <0.0001; 0.0023; 0.0003; 0.0005; Olig2/Ki67: 0.0078; 0.0123; 0.6769; 0.3403; 1,0000; 0.5568; Olig2/Olig1: <0.0001; 0.0036; 0.2937; 0.5173; 0.6591; 0.1931. Comparisons between experimental groups were made by the unpaired t test. Six brains per experimental condition were analyzed, and values are expressed as the mean ± SEM. *p < 0.05, **p < 0.01, ***p < 0.001 vs respective controls.

