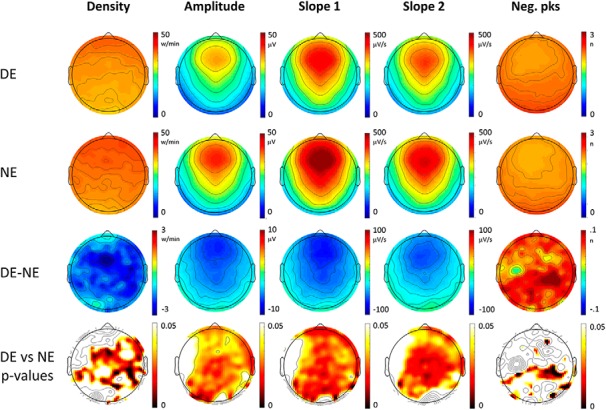
Figure 2.

Top row, Topographical distribution of slow-wave parameters for dream experiences (DEs) (first row) and no experiences (NEs) (second row). Slow-wave parameters were averaged over the last 60 s before the awakening and across 12 subjects. In the third row, the mean differences between DE and NE (DE − NE) are shown for each parameter, so that red colors indicate higher values in DE, and blue colors higher values in NE. In the fourth row, p values for paired electrode-by-electrode t tests are shown (p < 0.05, uncorrected).
