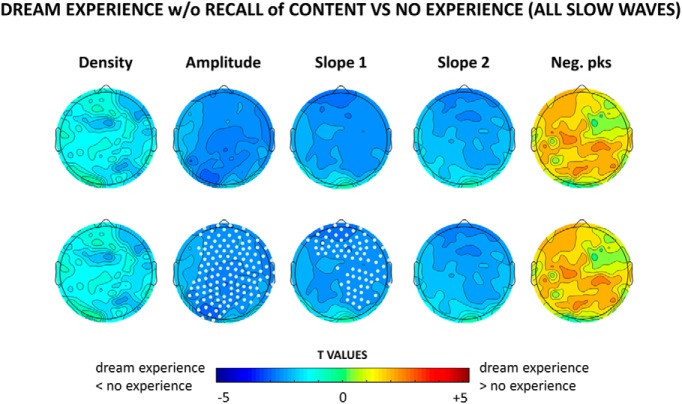
Figure 3.
Top row, Topographical distribution of t values for the contrast between dream experiences without recall of content and no experiences for different slow-wave parameters averaged over the last 60 s before the awakening. Bottom row, Same as the top row, but electrodes within a cluster showing a statistically significant effect are marked in white (p < 0.05, cluster-based correction for multiple comparisons, two-tailed paired t tests; n = 12 subjects).

