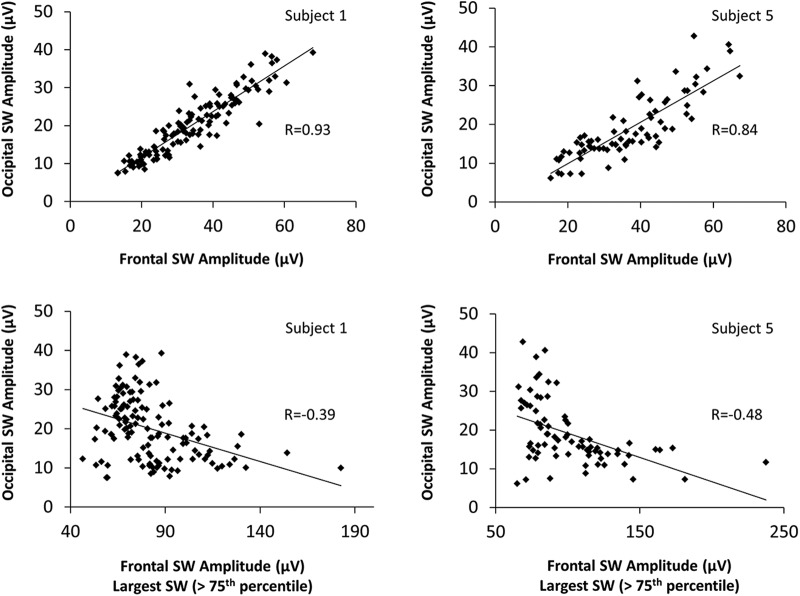
Figure 7.
Correlation between slow-wave amplitude in a frontal and occipital region of interest for two representative subjects. Top row, All slow waves (no amplitude threshold). Bottom row, An amplitude threshold (above the 75th percentile of all waves for each subject) was applied to frontal slow waves.

