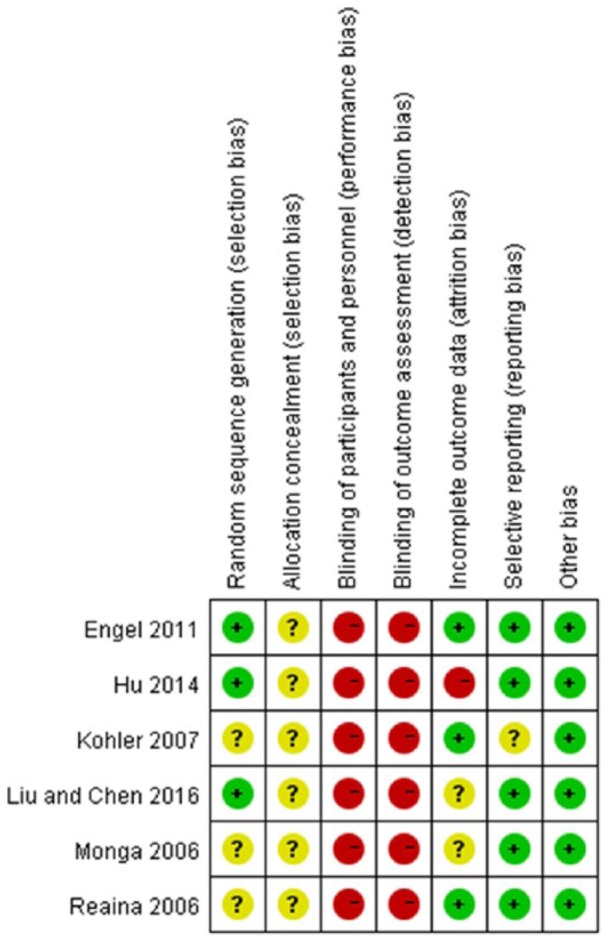
Figure 2.

Methodological quality assessment of the risk of bias for each included study.  = low risk of bias;
  = unclear risk of bias;
  = high risk of bias.

Methodological quality assessment of the risk of bias for each included study.  = low risk of bias;
  = unclear risk of bias;
  = high risk of bias.