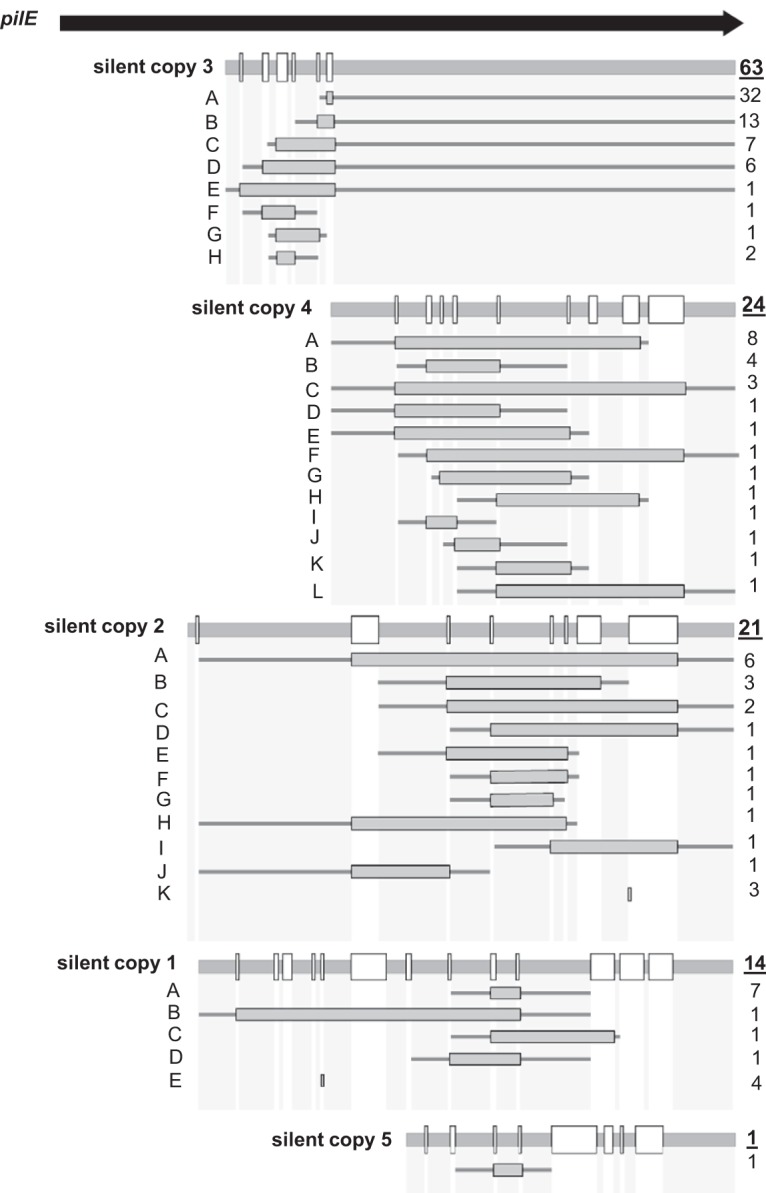
FIG 4.

Detailed analysis of pilE variants in Mc8013. The pilE gene is represented by the arrow at the top. For each silent donor copy, the level of sequence conservation with the starting pilE sequence is shown with sequences that are identical with pilE by the thick gray horizontal line and sequences that differ between the pilS copy and pilE represented by white boxes. The frequency of each recombination event is indicated on the right of each cartoon where the underlined number on top indicates the total number of events using the same silent copy donor. For each recombination event, the frequency of individual recombination events is indicated on the right of each cartoon, consisting of a gray box that indicates the extent of the transferred silent copy sequence in pilE and thin gray lines that indicate flanking sequences shared by pilE and the silent copy for each product.
