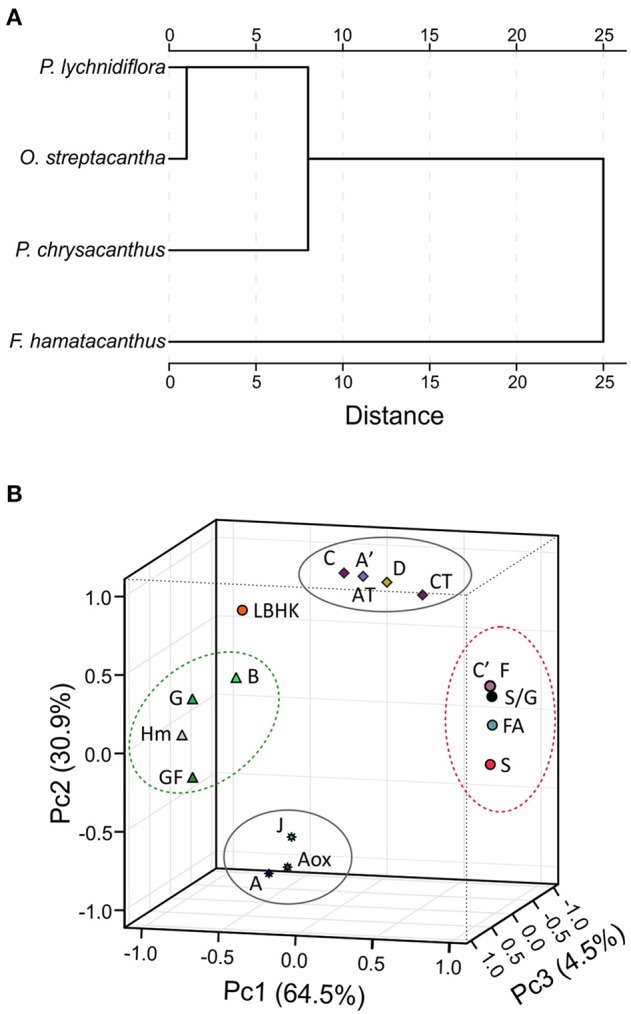
Figure 5.

Results of chemometric analyzes using relative abundances from HSQC spectra. (A) Dissimilarity of the lignin of the four species, measured based on the square of the Euclidean distance. (B) Three-dimensional graphic obtained by the principal component analysis using matrices including discrete variables. Letters correspond to the structures in Figures 3, 4. AT, total abundance of β-O−4′ ether structures; CT, total abundance of resinol structures; GF, growth form; Hm, height of the species. Structures E, I and St overlapped with structures C′ and F.
