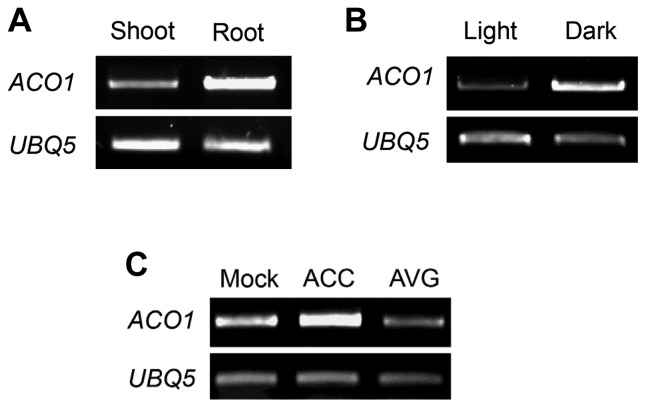
Fig. 1. ACO1 gene expression under various conditions.
(A) Comparison of ACO1 expression in the shoot and root of 5 DAG seedlings. Seedlings were cut into the shoot (cotyledon and hypocotyl) and root by a razor blade. The shoot and root fragments were subjected to total RNA extraction. (B) ACO1 expression in seedlings grown under different light conditions. Seedlings were grown in the light or in the dark for 5 DAG. (C) Ethylene precursor effect on ACO1 expression. Five DAG seedlings were treated with 1 μM ACC or 1 μM AVG for 6 hr. Semi-quantitative RT-PCR was performed with total RNA. PCR products were electrophoresed on 1% agarose gels and detected by ethidium bromide (EtBr) staining. UBQ5 was used to normalize the expression level.

