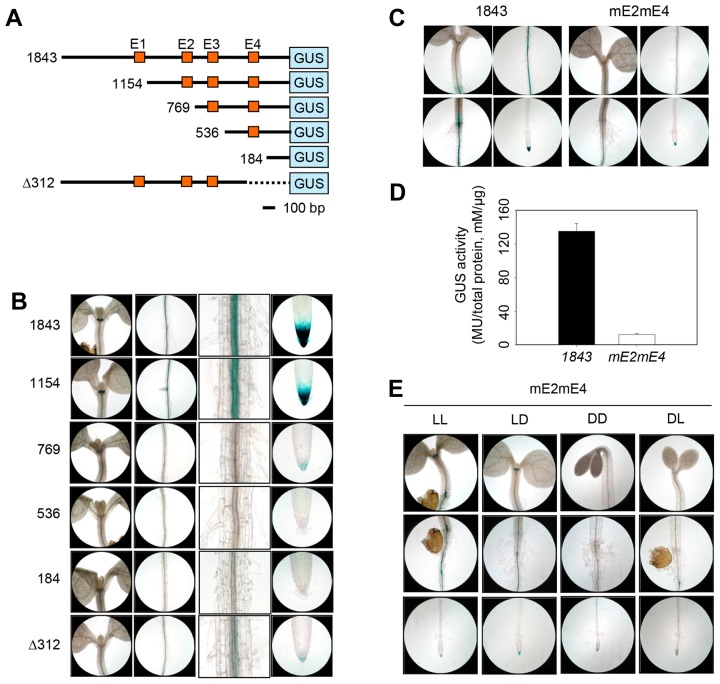
Fig. 5. Histochemical GUS staining in truncated series from ProACO1-GUS transgenic seedlings.
(A) Schematic diagram from truncated ACO1 promoter-GUS constructs. Numbers represent the number of nucleotides from truncated ACO1 promoters fused to GUS gene (blue box), except for Δ312, which indicates promoter deletion size. Orange boxes indicate localization of E-box motif (E1~E4). The bar represents 100 nucleotides in length. (B) GUS expression in truncated ProACO1-GUS seedlings. Seedlings from ProACO1-GUS 1843 (1843), ProACO1-GUS 1154 (1154), ProACO1-GUS 769 (769), ProACO1-GUS 536 (536), ProACO1-GUS 184 (184), and ProACO1-GUS Δ312 ( 312) were grown on vertically oriented plates for 5 DAG then subjected to GUS staining. From left to right, each image shows hypocotyl, root maturation zone, magnified root maturation zone, and root tip, respectively. Three or more seedlings were used for GUS staining and showed similar staining patterns. (C) Histochemical analysis of GUS activity in ProACO1-GUS 1843 and ProACO1-GUS 1843 mE2mE4 (mE2mE4). GUS staining was repeated with three independent transgenic plants and the representative of similar results are shown. (D) GUS activity quantification in ProACO1-GUS 1843 and ProACO1-GUS 1843 mE2mE4 (mE2mE4). Columns indicate mean values from two independent experiments. Error bars show standard deviation. (E) GUS expression in ProACO1-GUS 1843 mE2mE4 (mE2mE4) seedlings under different light conditions; continuous light-grown (LL), light-grown seedlings treated with dark (LD), continuous dark-grown (DD) and dark-grown seedling treated with light (DL).

