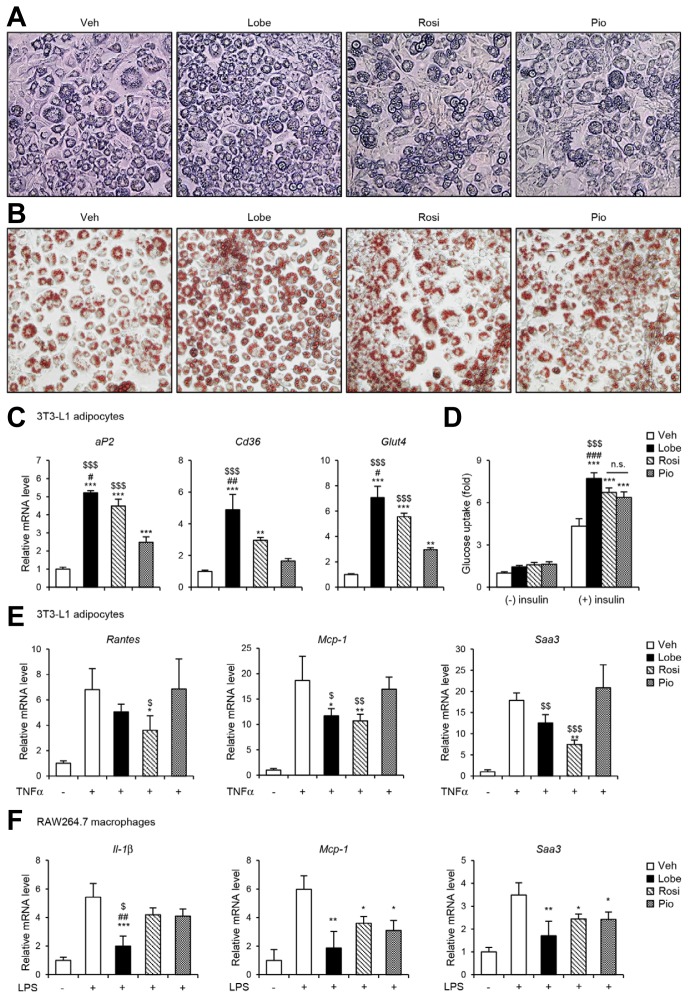
Fig. 1. TZDs stimulate adipocyte function and reduce pro-inflammatory genes in adipocytes and macrophages.
3T3-L1 cells were treated with 10 nM of Lobe, Rosi, Pio, or vehicle (DMSO) during adipogenesis. (A) Microscopic images (magnification, 100×), (B) Oil-red-O staining (magnification, 100×) and (C) adipogenic gene expression were assessed by RT-qPCR. The data represent the mean ± SD for n = 3 in each group. **P < 0.01, ***P < 0.001 vs. vehicle group; #P < 0.05, ##P < 0.01 vs. Rosi group; $$$P < 0.001 vs. Pio group by one-way ANOVA followed by Tukey’s post-hoc test. Also, (D) insulin-stimulated glucose uptake was analyzed. The data represent the mean ± SD for n = 3 in each group. ***P < 0.001 vs. insulin-treated vehicle group; ###P < 0.001 vs. insulin-treated Rosi group; $$$P < 0.001 vs. insulin-treated Pio group by two-way ANOVA followed by Bonferroni’s post-hoc test. (E) Differentiated 3T3-L1 adipocytes were pretreated with 10 nM of Lobe, Rosi, or Pio for 4 h before TNFα (10 ng ml−1) treatment for 14 h. After treatment, pro-inflammatory gene expression was analyzed by RT-qPCR. (F) RAW264.7 cells were pretreated with 5 μM of Lobe, Rosi, or Pio for 4 h before LPS (10 ng ml−1) treatment for 6 h. After treatment, pro-inflammatory gene expression was analyzed by RT-qPCR. The data represent the mean ± SD (n = 4 per group). *P < 0.05, **P < 0.01, ***P < 0.001 vs. vehicle, pro-inflammatory stimuli group; ##P < 0.01 vs. Rosi group; $P < 0.05, $$P < 0.01, $$$P < 0.001 vs. Pio group by one-way ANOVA followed by Tukey’s post-hoc test. All RT-qPCR data were normalized to the mRNA level of cyclophilin. Veh, vehicle; Lobe, lobeglitazone; Rosi, rosiglitazone; Pio, pioglitazone; n.s., not significant.

